SharePoint development state in 2020: story based on sharepoint.stackexchange analysis with Power BI
The year 2020 is over and once again it’s time to perform regular analysis of data at sharepoint.stackexchange. This is the fourth edition of such an analysis.
Tools used to collect and analyze data:
- Power BI with Power BI Desktop - super cool tools for data analysis. If you don’t have experience with Power BI, it’s worth trying to see what is possible. When I first tried it a few years ago I was sooo impressed with power yet simplicity in performing data analysis and building visualizations. It works very well for both simple and advanced scenarios. I believe that everybody will find these tools useful for any kind of data analysis.
- DaxStudio - an extremely useful tool to test your DAX queries.
- Power BI Community - Power BI has a very strong community. I found a lot of answers at their forum, I even asked some questions and community helped with valid answers. That’s not a “tool” but worth mentioning. I am grateful for all the answers.
- Stack Exchange API
The source code used to gather initial data is available at GitHub.
The report
Click to open in a separate tab
Previous reports:
- 2019 Edition - Power BI report and blog post
- 2018 Edition - Power BI report and blog post
- 2017 Edition - Power BI report and blog post
- 2016 Edition - Power BI report and blog post
Disclaimer
All thoughts are mine. Maybe they are not correct or you might think differently. Please share your thoughts and opinion in the comments.
Tags
For tags the situation is exactly the same as it was before - SharePoint Online is a trending tag here, so no changes:
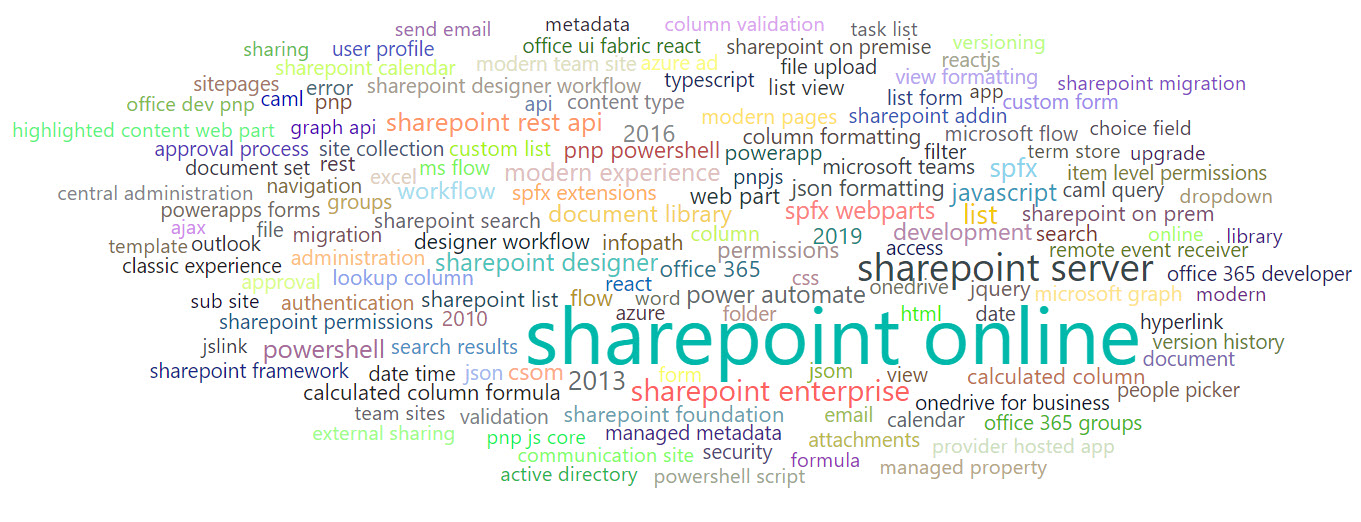
Just want to remind some interesting observation (also not surprising, but anyway):
Everything you know about SharePoint development right now will be completely invalid in less 10 years.
That’s not bad and not good, that’s just how things are in modern development for any platform\technology.
We still don’t see lots of “teams” tag, but maybe teams is something different and SharePoint StackExchange is not the right place for answers about teams.
Questions
Let’s take a look at the questions.
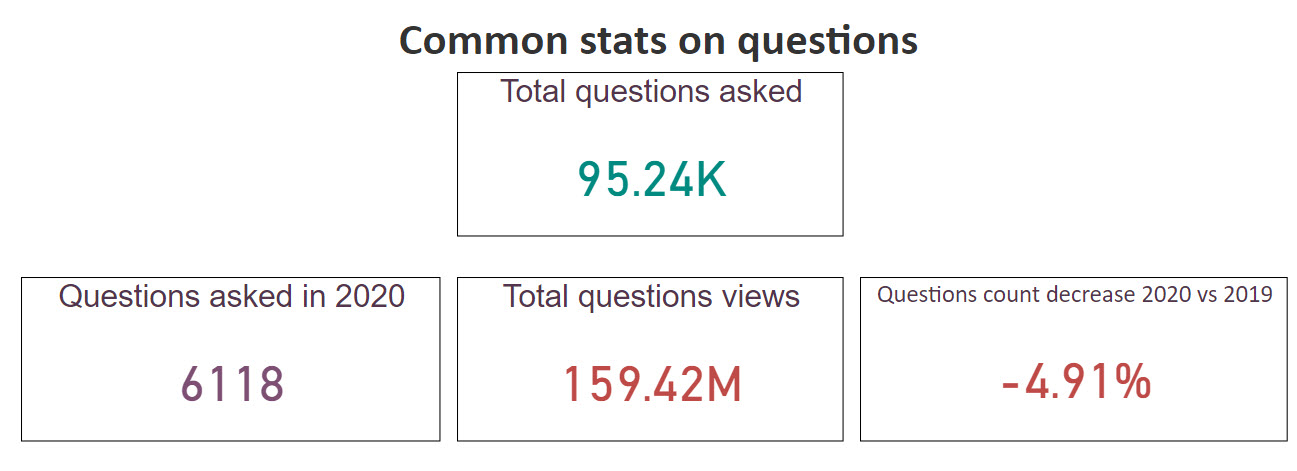
The number of questions slightly decreased in 2020. However, this number is not final, because last year I found out that every year a lot of questions were removed (spam or just not good questions that violate rules). So the actual number will be even smaller.
If we take a look at the monthly distribution, then we will see the below picture:
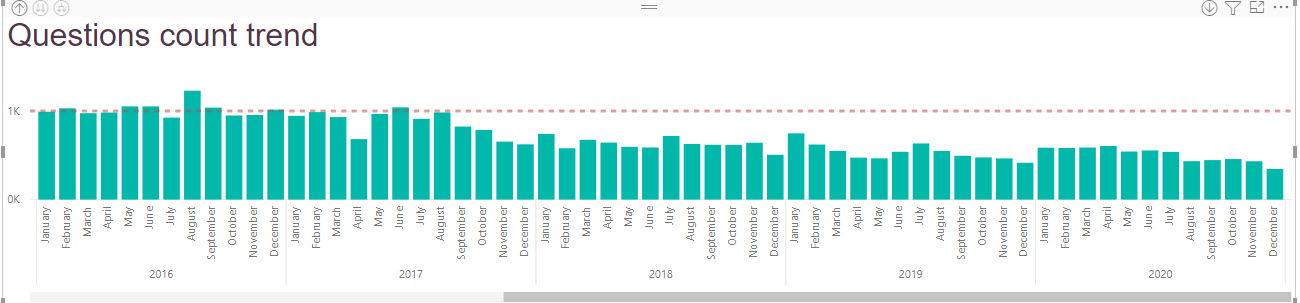
In general, users are less actively ask questions starting from 2017.
Now let’s take a look at how many questions received n answer, how many answers were accepted, and how many questions haven’t received any answer.
TODO - image
In this picture, we see, that in 2020 a lot more questions were left unanswered. Some of them will receive an answer in 2021, but only a small amount. It leads to a very sad conclusion:
Approximately 65% of questions don’t have an accepted answer. Last year it was 60%.
If we compare with the 2019 year, then we again see a slight increase in the number of questions without an accepted answer.
When it comes to questions state trend, the situation in 2020 is almost the same as for 2019, meaning that the number of unanswered questions increases:
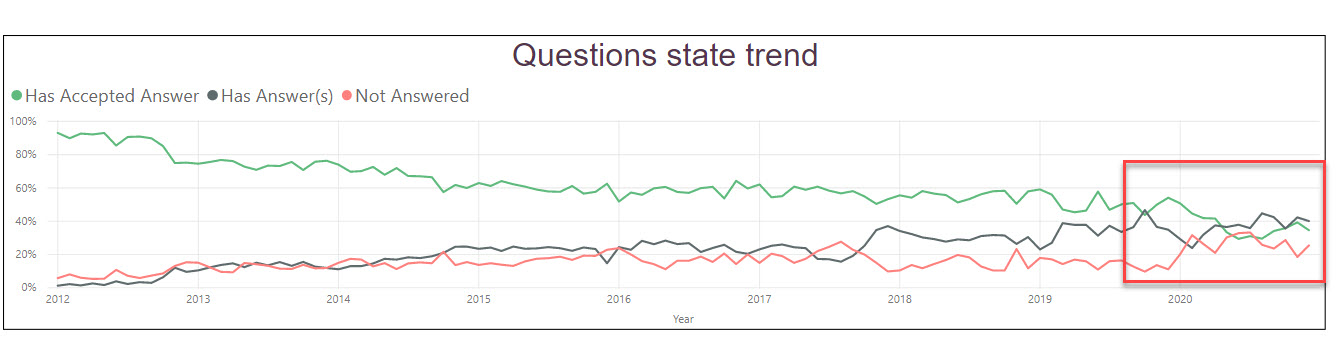
The only difference is that in 2020 we have a lot more unanswered questions. Partially it’s connected with spam questions I mentioned above, which will be deleted and the red line will go up. However, even in that case, it looks like the number of unanswered questions is slightly increasing.
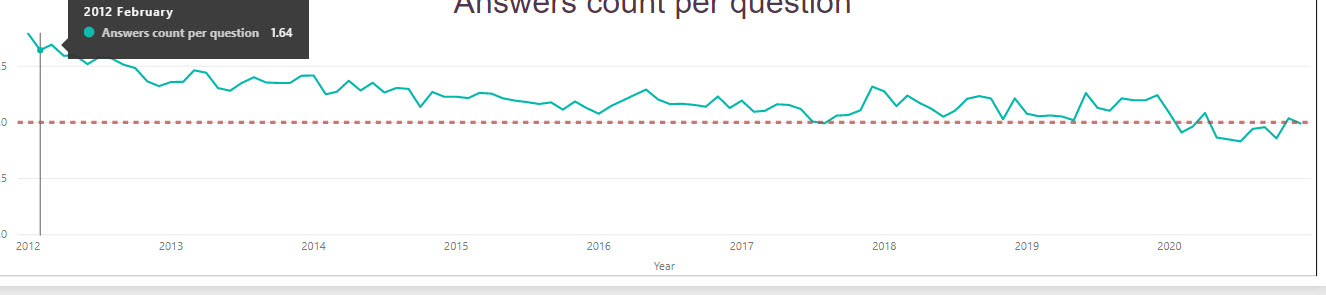
As a result, the answers count per questions also goes down:
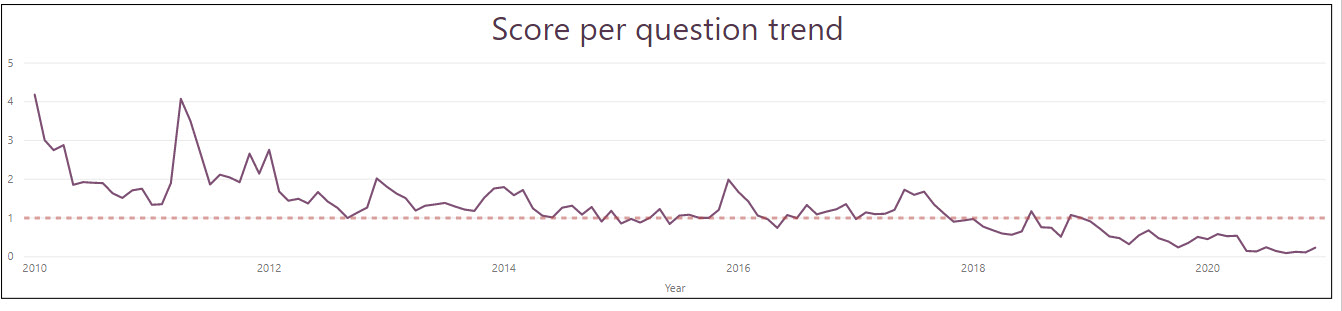
The same also applies for score per question trend - on average a question received fewer points in 2019-2020:
InfoPath
That’s one of my favorite things. “Infopath” anomaly. Users still ask questions about InfoPath (every time I hear this word I feel bad :)).
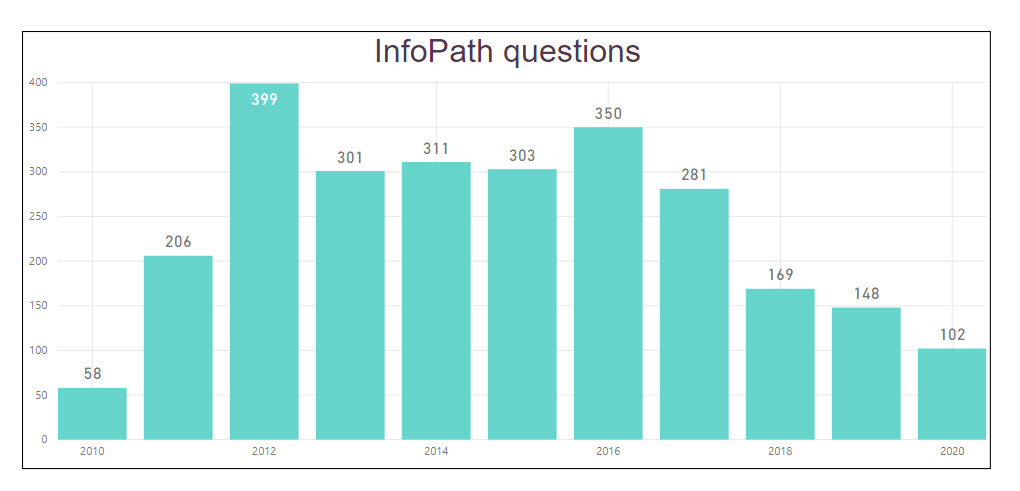
Fortunately, the number of InfoPath questions is decreasing.
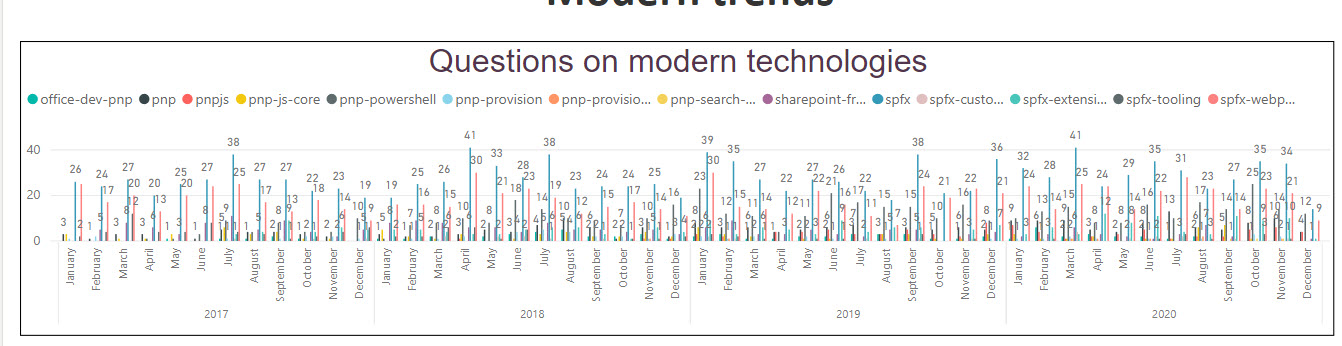
Modern trends in questions
As usual, we see a strong increase in the number of questions on modern things. By modern I mean PnP, SharePoint Framework aka SPFx, pnpjs and everything about:
Answers
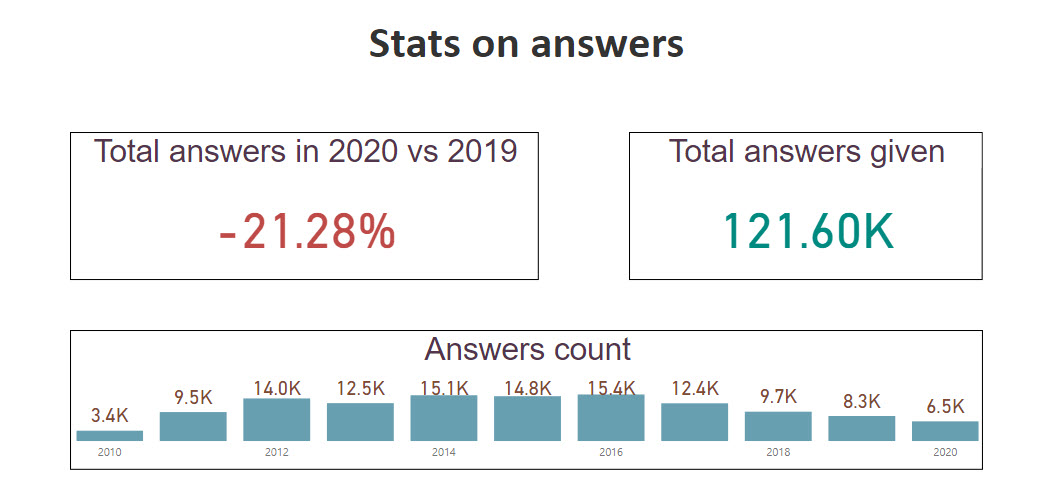
In 2020 users were answering questions 20% less often when compared to the previous year
Below two charts show how many answers were given (trend) and how many answers were upvoted \ not upvoted. As we already have seen that users’ activity in 2020 goes down, the below charts prove it.
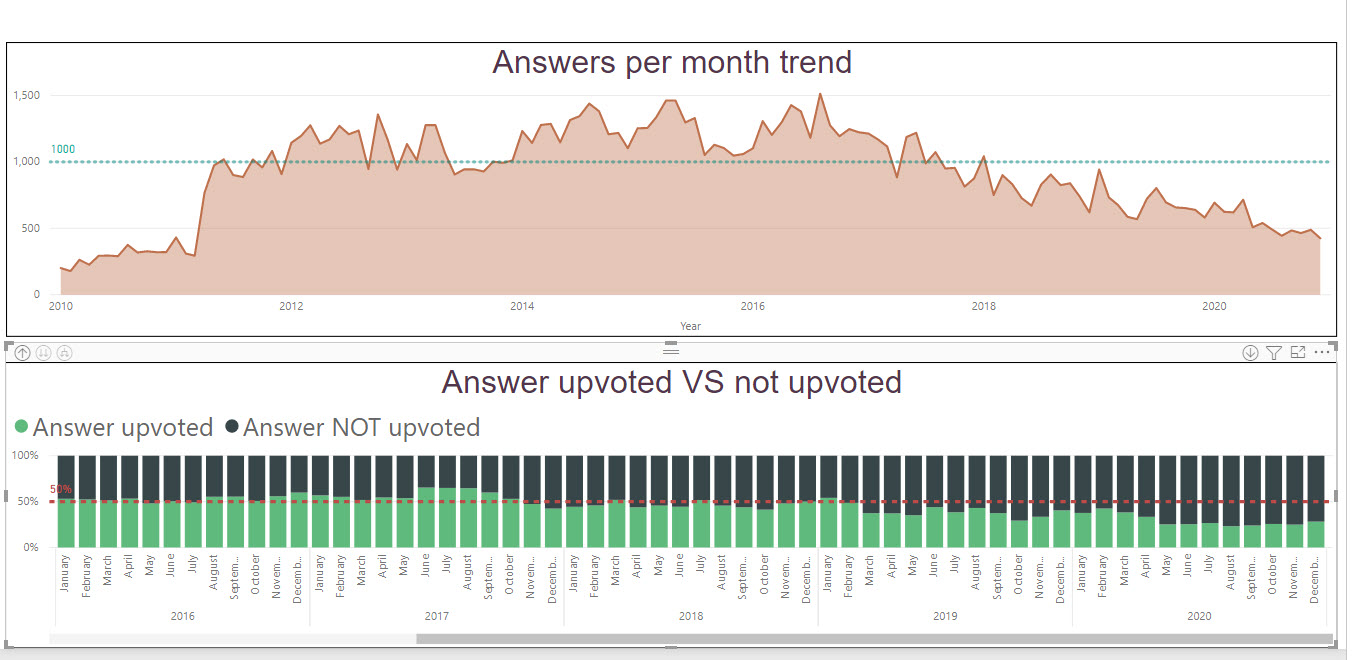
In general, the situation looks the same as for 2019 - upvotes and answers slowly go down.
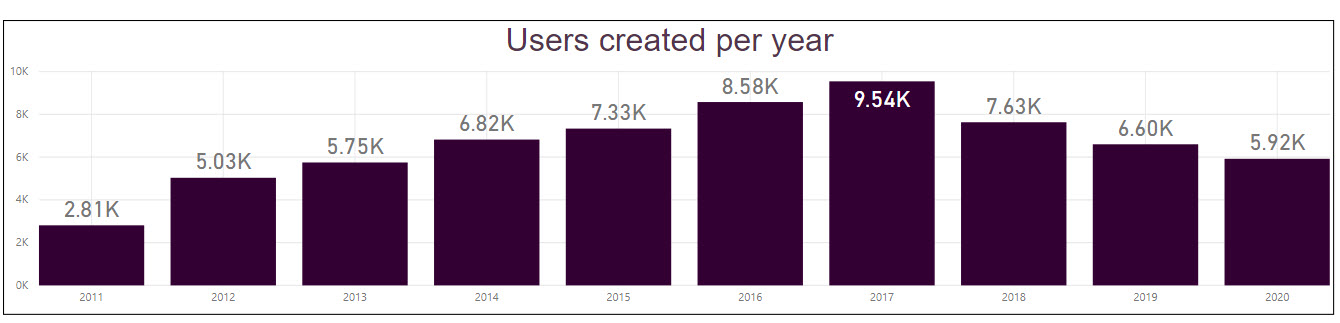
Users
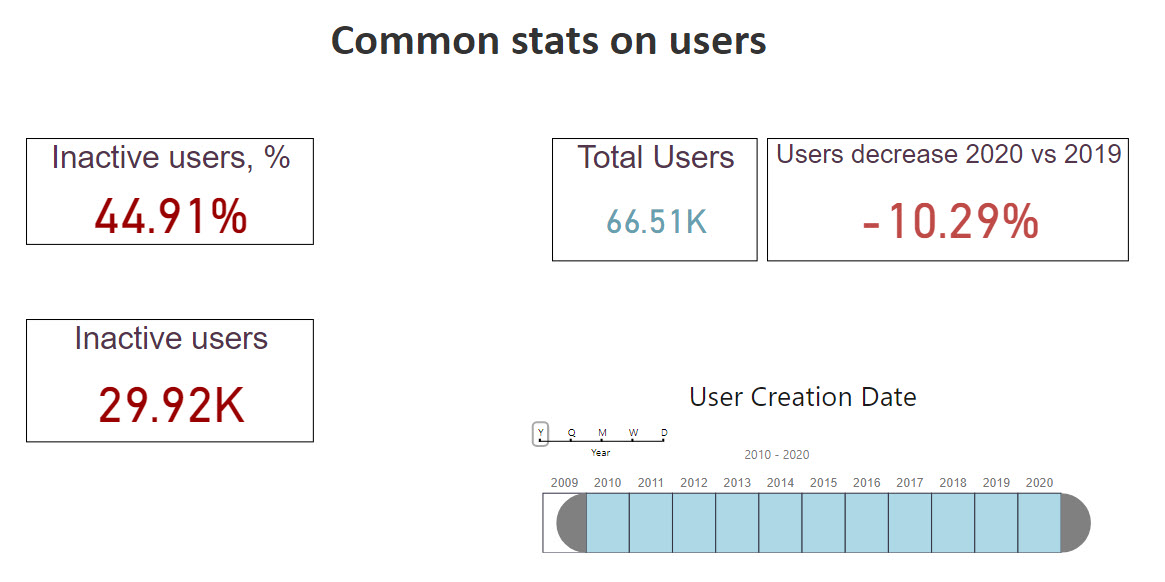
The number of registered users decreased in 2019 (the same as in 2018). Still, there are a lot of inactive users (no answers and no questions). I don’t know the nature of these users.
The below trend clearly demonstrates that the popularity of SharePoint StackExchange slowly decreases over time:
TOPS (all time)
As usual, some statistics on TOPs.
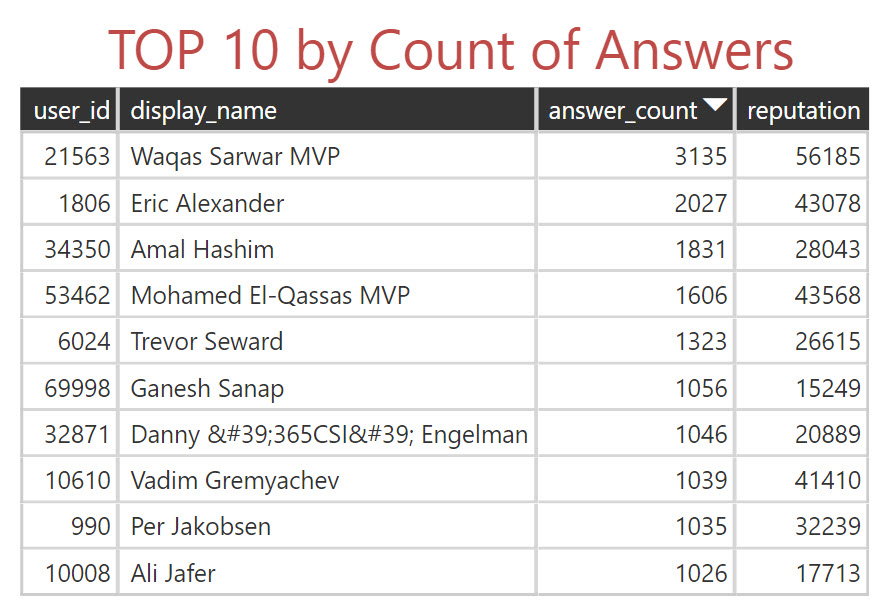
TOP 10 by the count of answers
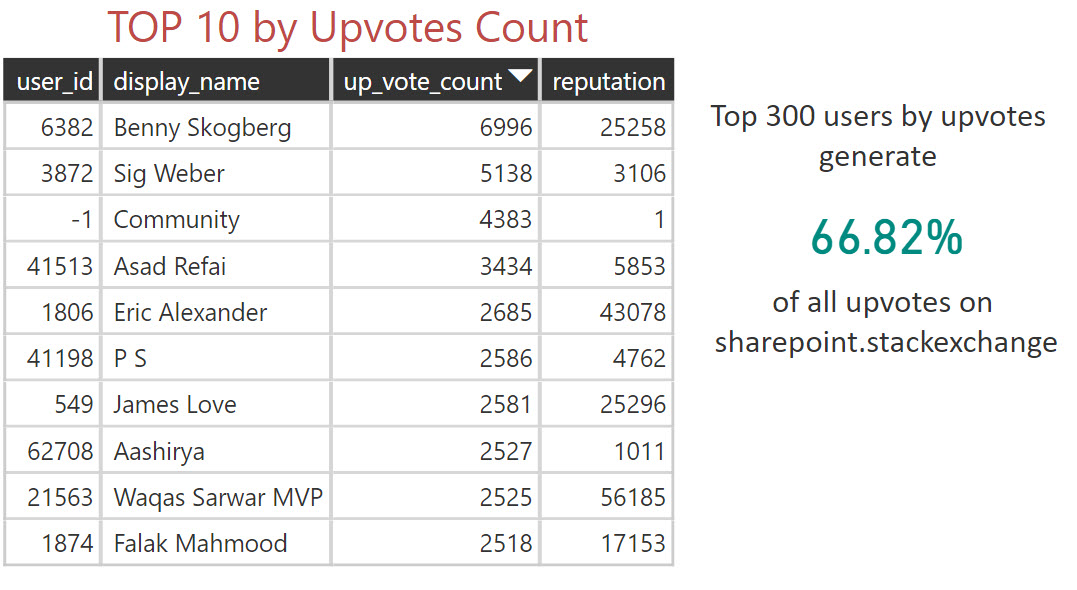
TOP10 by upvotes count
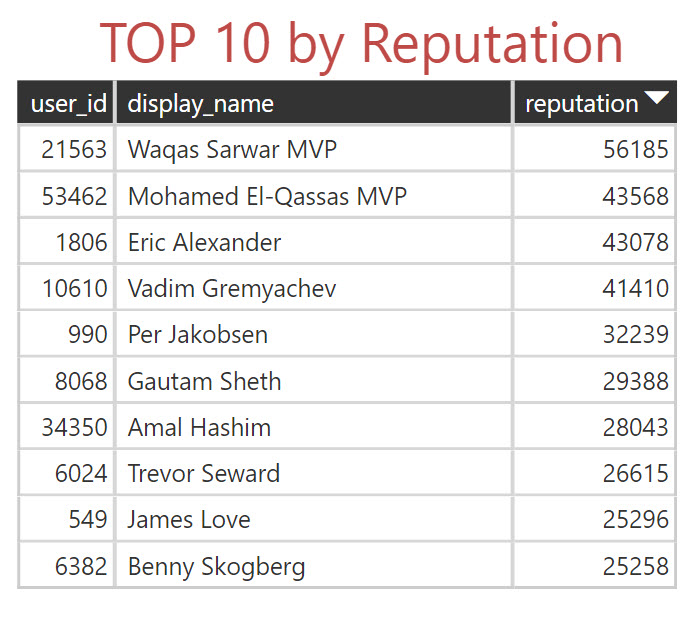
TOP 10 all
Microsoft
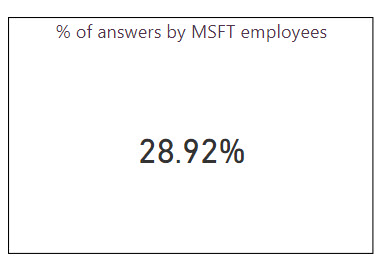
In the previous releases of the analysis (2018-19) I mentioned increased activity from Microsoft employees. In 2020 the situation was improved and even more Microsoft employees gave answers to questions.
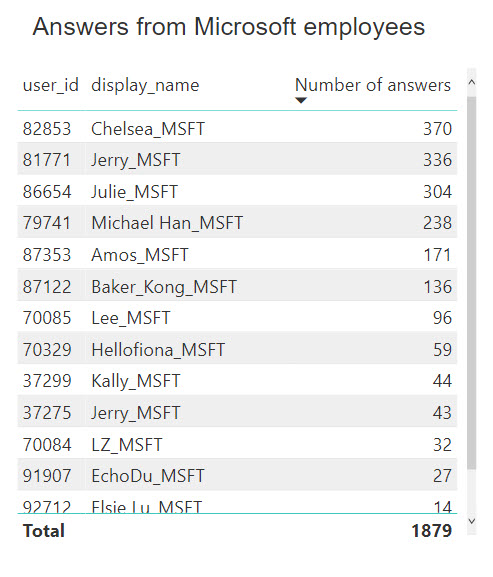
In 2019 Microsoft employees gave ~1.9k answers. It’s a lot and more than in 2018 and 2019.
When compared with the total number of answers in 2020, it gives us
Conclusion
From year to year, we observe, that the number of answers and questions slowly go down. At the same time, the amount of answers from Microsoft increases. Also, a small group of active SharePoint professionals additionally provide a significant amount of answers. However, for me, it looks like SharePoint StackExchange slowly transforms into an additional Q&A resource for Microsoft with questions about SharePoint. I mentioned the reasons before, they remain the same:
- Other Q&A forums
- the rise of GitHub as Q&A through issues and discussions
- SharePoint today is a too broad term