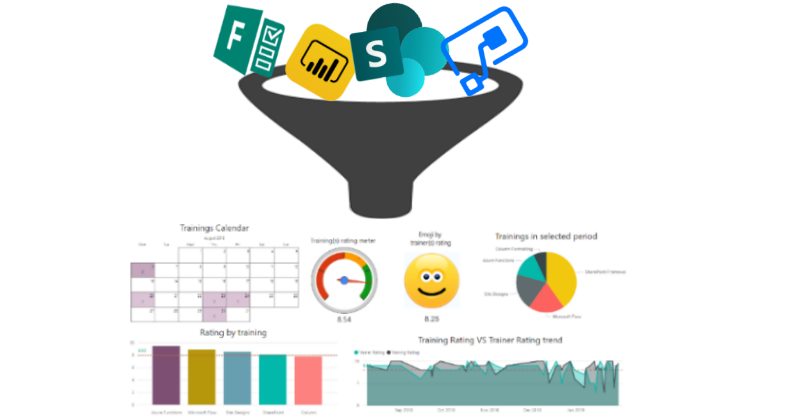
The result
Ingredients
- Microsoft Flow - one piece
- Power BI report - one piece
- Modern SharePoint Power BI web part - one piece
- Mikael Svenson's post - Working with Hub Sites and the search API - one piece
Preparations
Well, actually we don't need any specific preparations. Just have a cup of tea or coffee if you wish :)
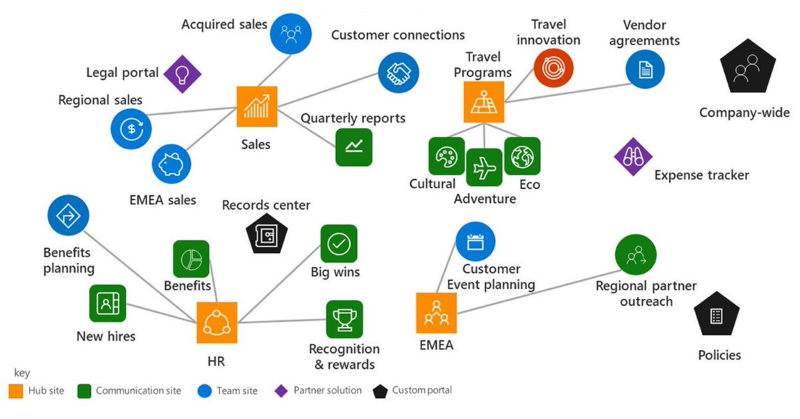
The idea is that we query all hub sites and associated sites into a SharePoint list on schedule using MS Flow. Then we use Power BI with SharePoint as a data source to read hub sites data and visualize it on a report. More...
Office365 family provides a lot of services for you and your organization. In recent weeks I was playing \ working with some of them like Power BI and MS Flow.
I wrote an article about sharepoint.stackexchange analysis with Power BI. Power BI is a great tool for data analysis. With Power BI Desktop you can create great visualizations of your data and share it with your colleagues or publish on the web. It nicely integrates with modern SharePoint Online as well.
MS Flow provides a way to automate a lot of different processes and simplify business cases. It also a very powerful tool in a different area - process automation. How to combine all of them and build something useful, engaging and interesting? That's the question I came up when I was working with these tools. Well, there are a lot of options available. It all depends on your imagination or concrete business case. I ended up with an interactive feedback analysis system. More...