SharePoint development state in 2018: story based on sharepoint.stackexchange analysis with Power BI
The year 2018 is over and it’s time to perform regular analysis of data at sharepoint.stackexchange. This is the third edition of such analysis.
Tools used to collect and analyze data:
- Power BI with Power BI Desktop - super cool tools for data analysis. If you don’t have experience with Power BI, it’s worth trying to see what is possible. When I first tried it two years ago I was sooo impressed with power yet simplicity in performing data analysis and building visualizations. It works very well for both simple and advanced scenarios. I believe that everybody will find these tools useful for any kind of data analysis.
- DaxStudio - extremely useful tool to test your DAX queries. I found it recently and it helped me a lot.
- Power BI Community - Power BI has a very strong community. I found a lot of answers at their forum, I even asked some questions and community helped with valid answers. That’s not a “tool” but worth mentioning. I am grateful for all the answers.
- Google Maps Geocode API
- Stack Exchange API
- osmosis - nodejs webpages scrapper
The source code used to gather initial data is available at GitHub.
Links
- Power BI report - actual report, which is analyzed in this post. You can open and play with it in your browser! (Hint: use navigation in the centre bottom of a page)
- Source files stack-analysis.zip (53.48 mb) (to play locally)
Previous reports:
- 2017 Edition - Power BI report and blog post
- 2016 Edition - Power BI report and blog post
Disclaimer
All thoughts are mine. Maybe they are not correct or you simply think differently. Please share your thoughts and opinions in comments.
Ok, let’s get started! :)
Tags
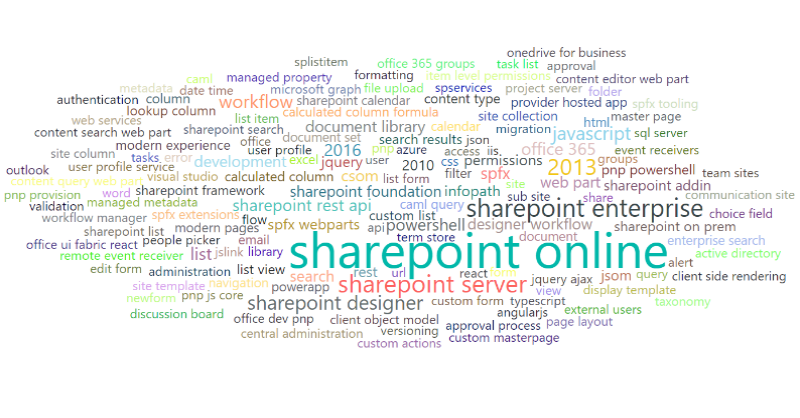
The picture with tags hasn’t changed drastically when compared with 2017. SharePoint Online is still trending tag and holds even more solid position in 2018.
Compare top tags all time:
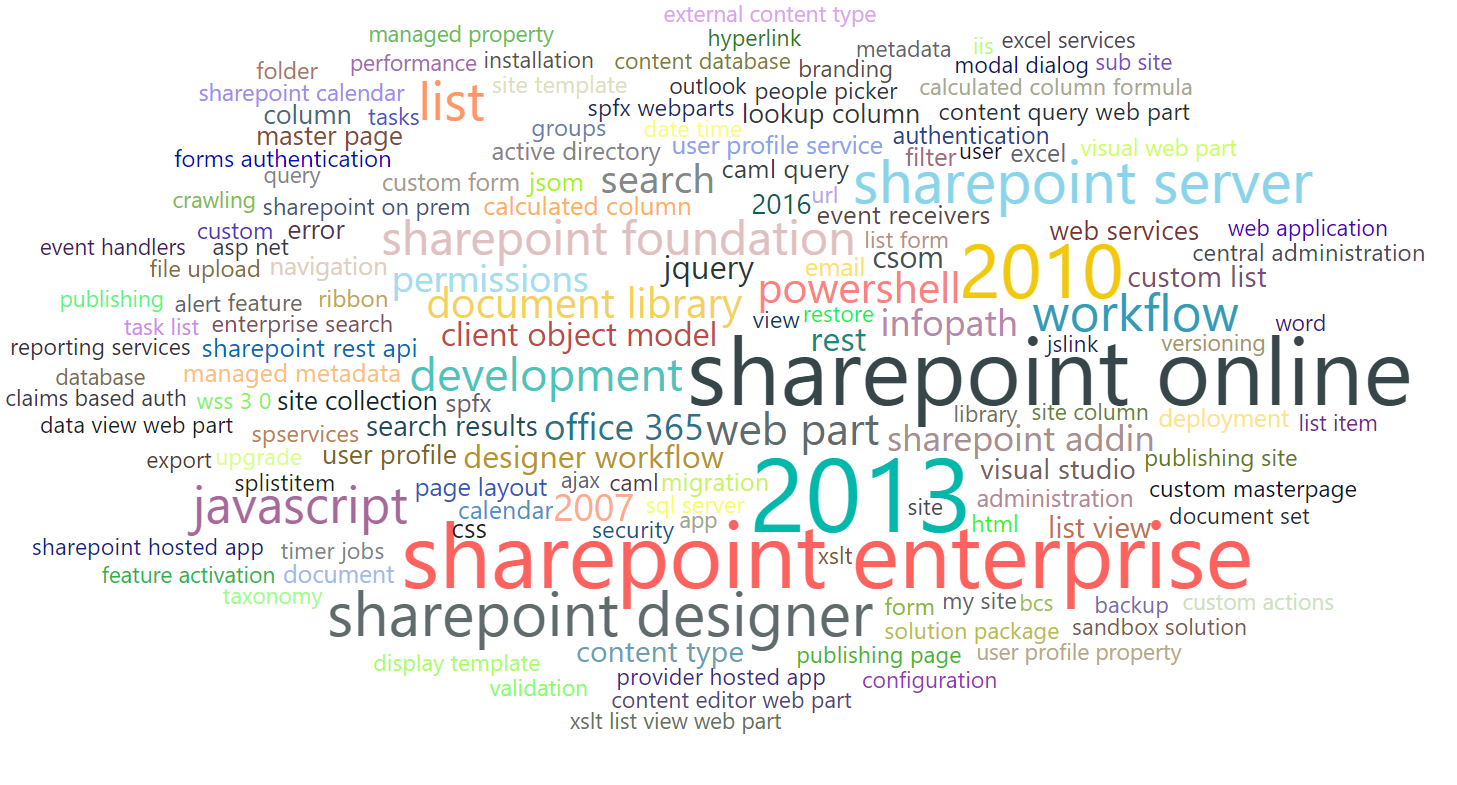 And top tags for 2018:
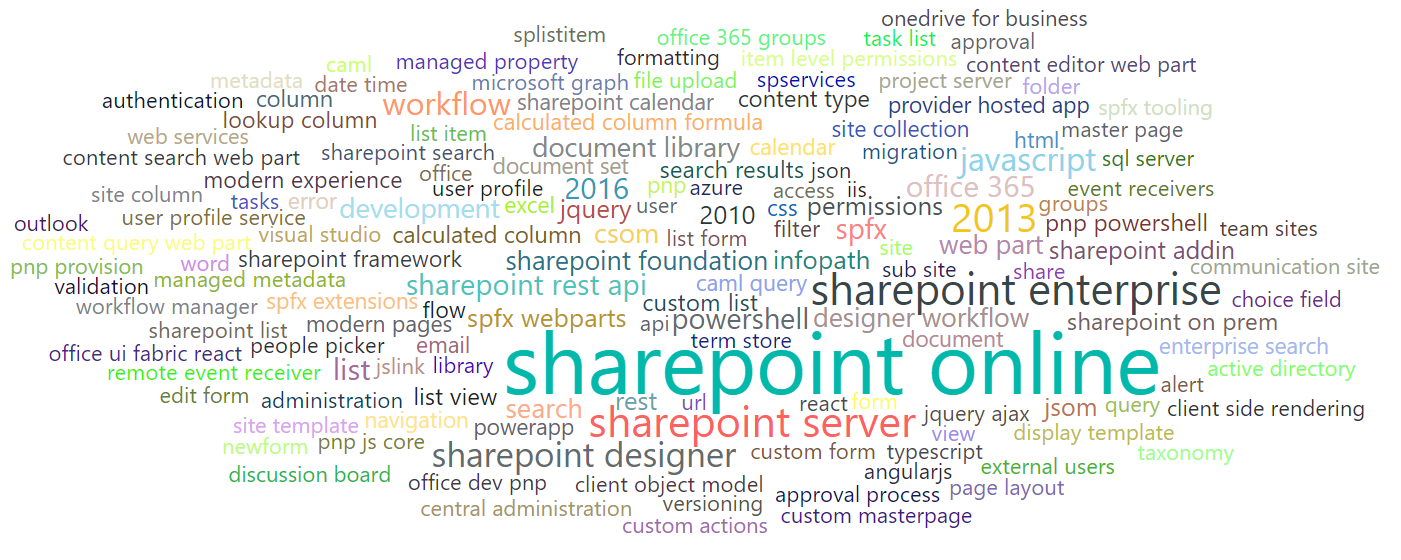
SharePoint Online is dominating here. The thing is that everything is changing very quickly. SharePoint Online has become a trend in 5 years. I bet in the next 5 years something else is going to replace this tag. MS Teams? MS Flow & Power Apps? SharePoint Framework? What do you think?
Questions
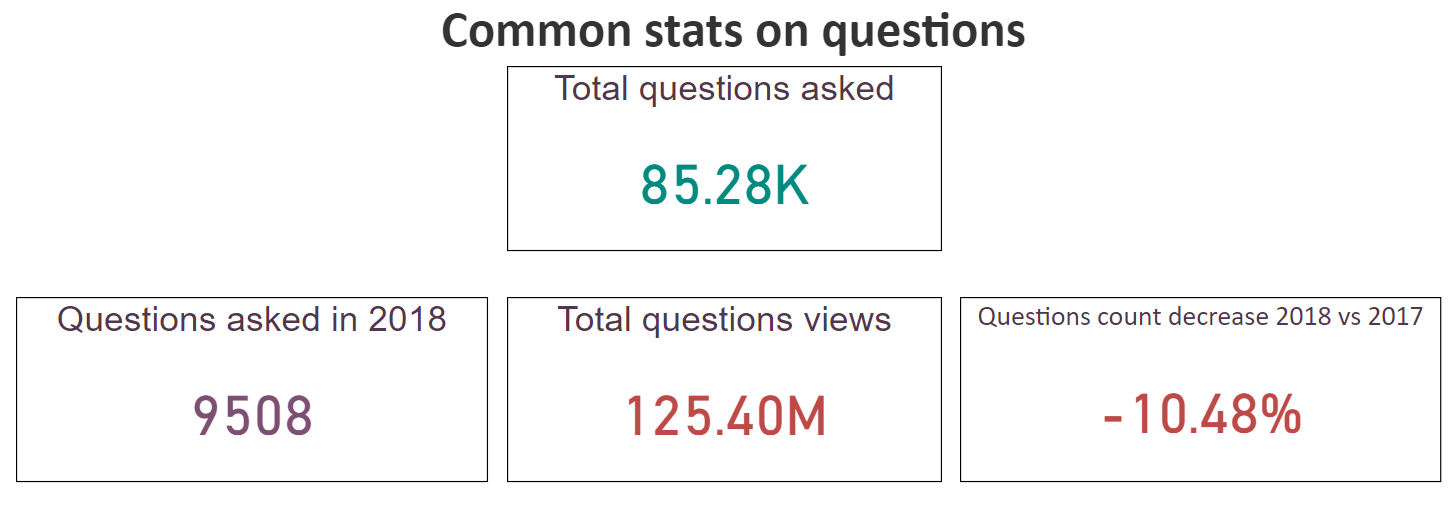
In 2018 users asked questions less frequently
In numbers, users asked 1k questions less than in 2017.
If we take a look at questions per month trend, we will see that starting from September 2017 users constantly were asking less than 1k questions per month (it was not the case before Sept. 2017):
[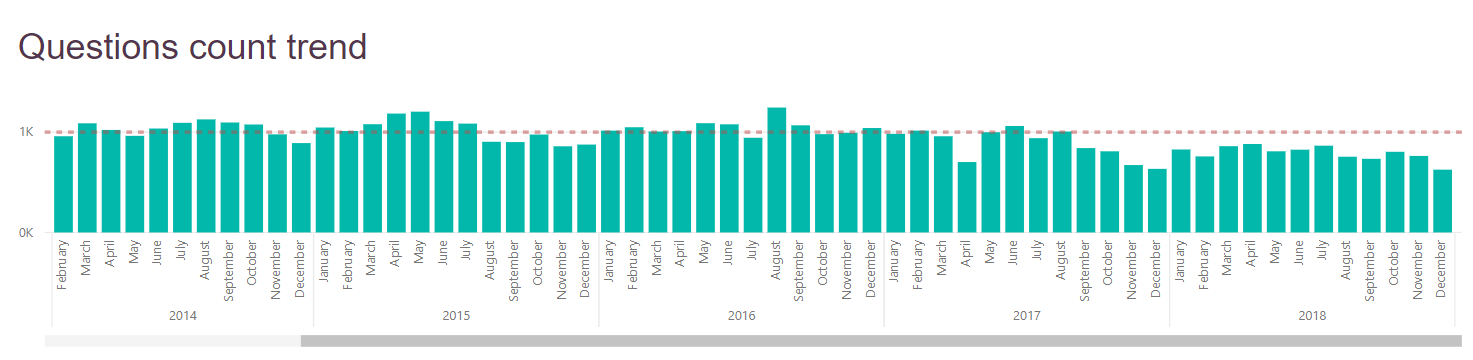](/image.axd?picture=/2019/stack-analysis/questions%20count trend.png)
That’s an interesting anomaly because in the whole 2018 year the number of questions per month was less than 1k. That has never happened before. I don’t have an idea why questions activity goes down starting approximately in fall 2017. If you have an idea, please share it in comments.
Now let’s take a look at how many questions received an answer, how many answers were accepted and how many questions haven’t received any answer.
[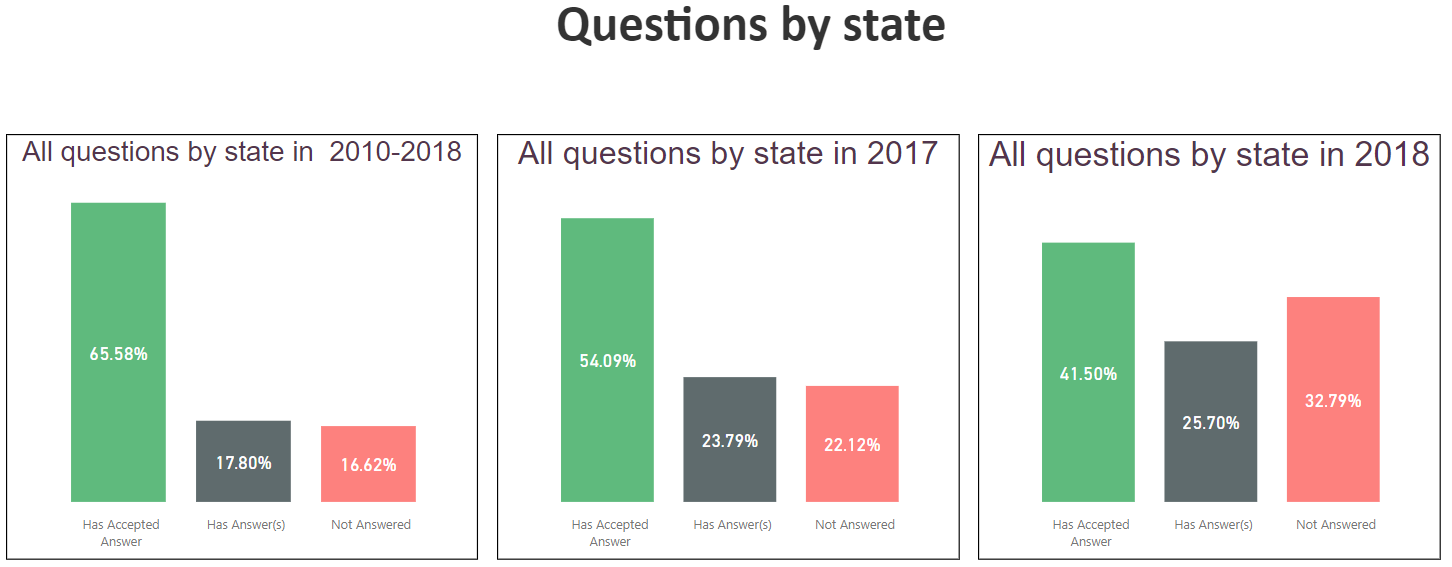](/image.axd?picture=/2019/stack-analysis/questions%20by state.png)
The amount of accepted answers is less than in 2017, however, in the upcoming months, some questions will receive answers and statistics will be a bit better. I would say that nothing has changed drastically in comparison to 2017 or 2016 years.
However, questions state trend continues changing. It changes for the worse:
[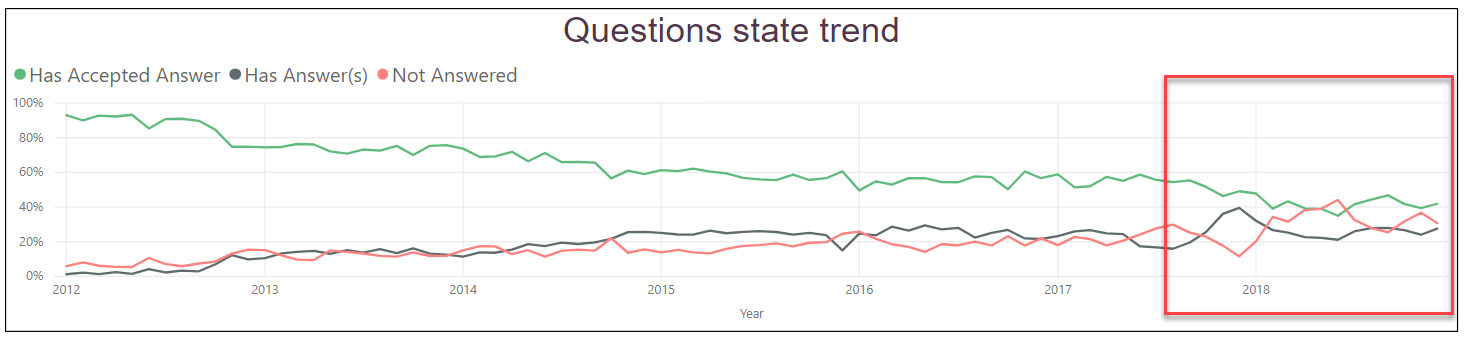](/image.axd?picture=/2019/stack-analysis/questions%20state trend.png)
The green line should stay higher, which basically means that more questions receive an accepted answer. However the green line slowly goes down and the red line (questions without an answer) goes up, which is not a good tendency. The amount of answer also goes down slowly, the next chart proves it:
[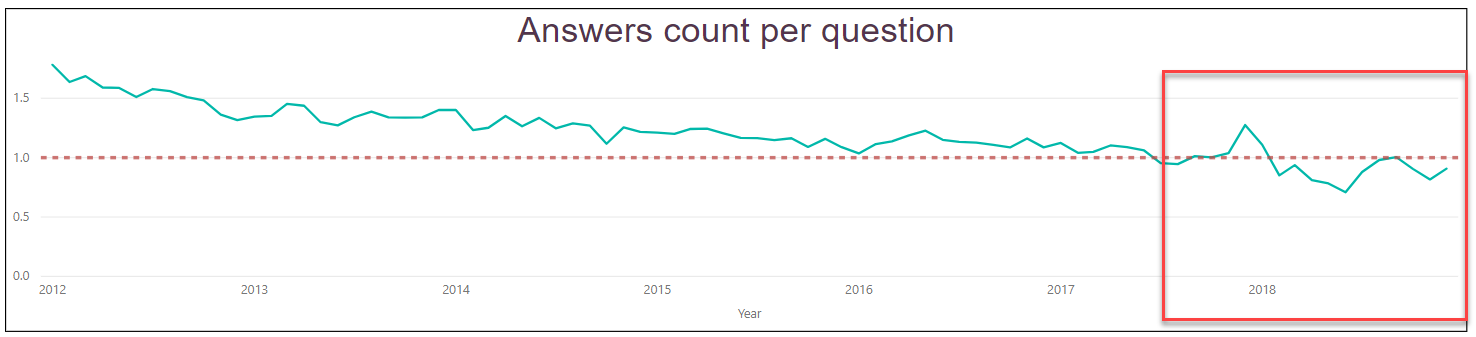](/image.axd?picture=/2019/stack-analysis/answers%20count per question.png)
In 2018 in average, a question receives less than one answer. It did not happen before 2018.
Score per question trend also goes down in 2018, which proves that the users’ activity in 2018 is slowly going down as well:
[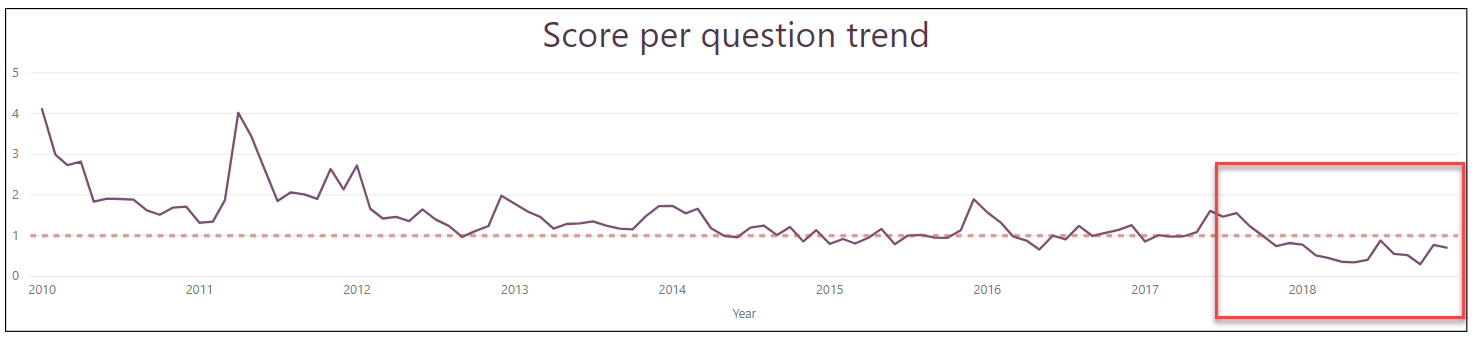](/image.axd?picture=/2019/stack-analysis/score%20per question trend.png)
How many questions an average user asks? Take a look:
[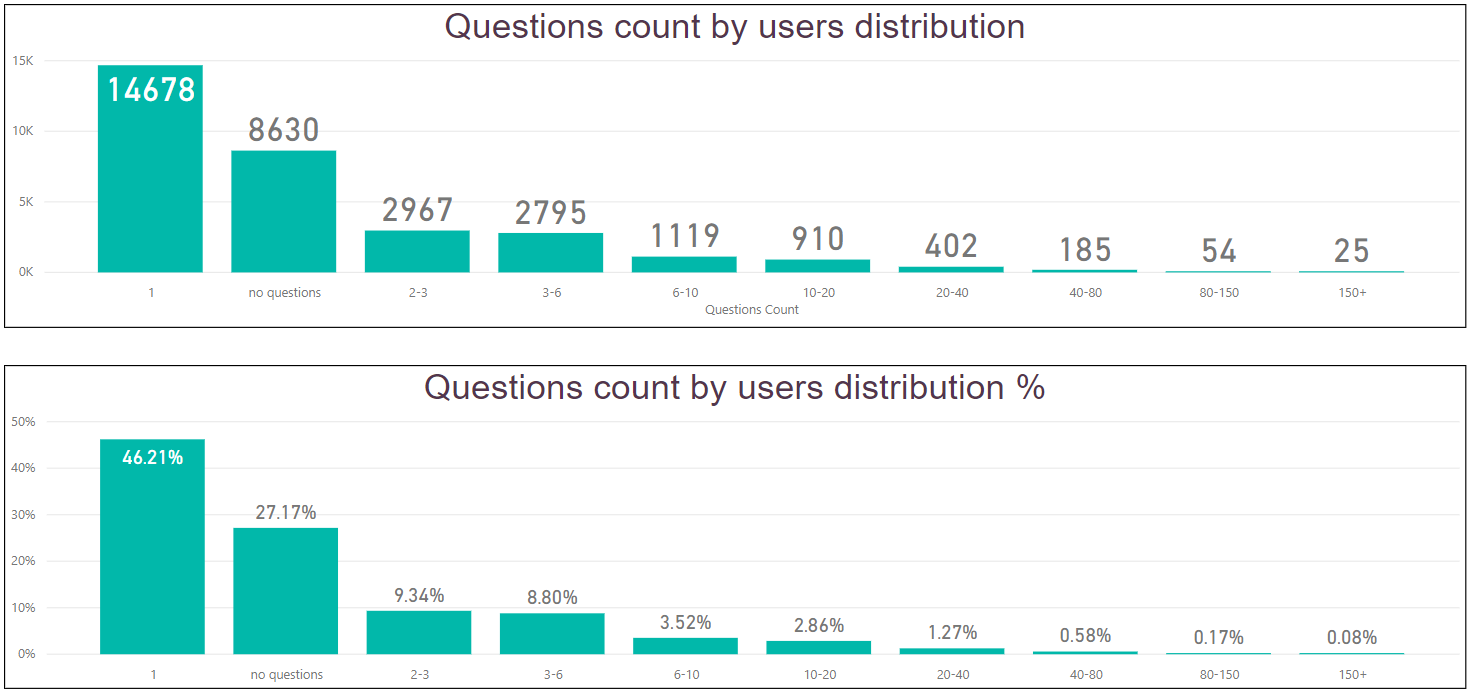](/image.axd?picture=/2019/stack-analysis/questions%20count by users.png)
25 users have asked more than 150 questions.
InfoPath
InfoPath?! Yes, InfoPath!
In previous years I found that the number of questions with InfoPath tag was really big. Fortunately this year in 2018 the amount of InfoPath questions goes down:
[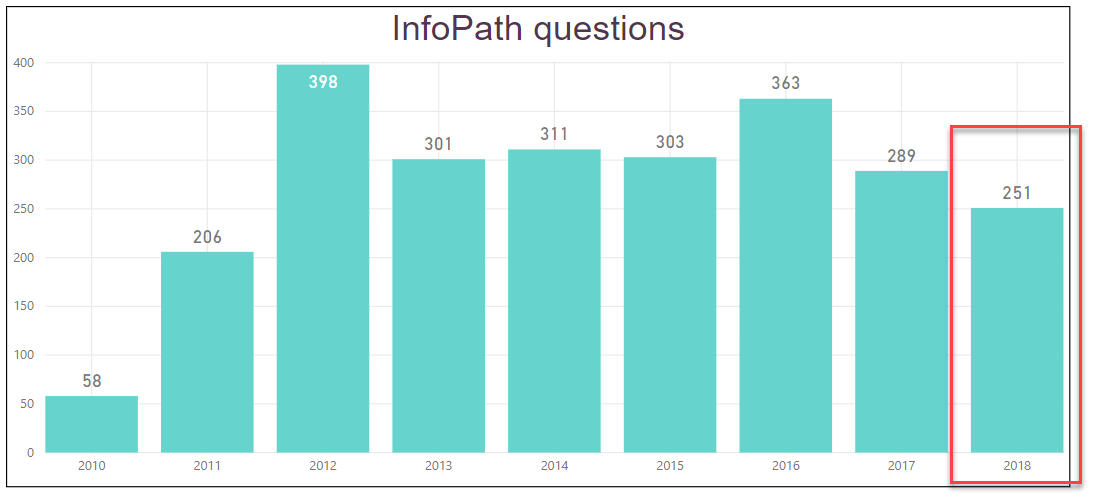](/images/blog/2019/sharepoint-development-state-in-2018-story-based-on-sharepoint-stackexchange-analysis-with-power-bi/infopath questions.png)
Maybe somewhen we will see zero in this column. Probably in 2050 :)
Modern trends in questions
Modern technology continues expansion. A very good sign of it is that the amount of questions with “modern” tags is increasing:
[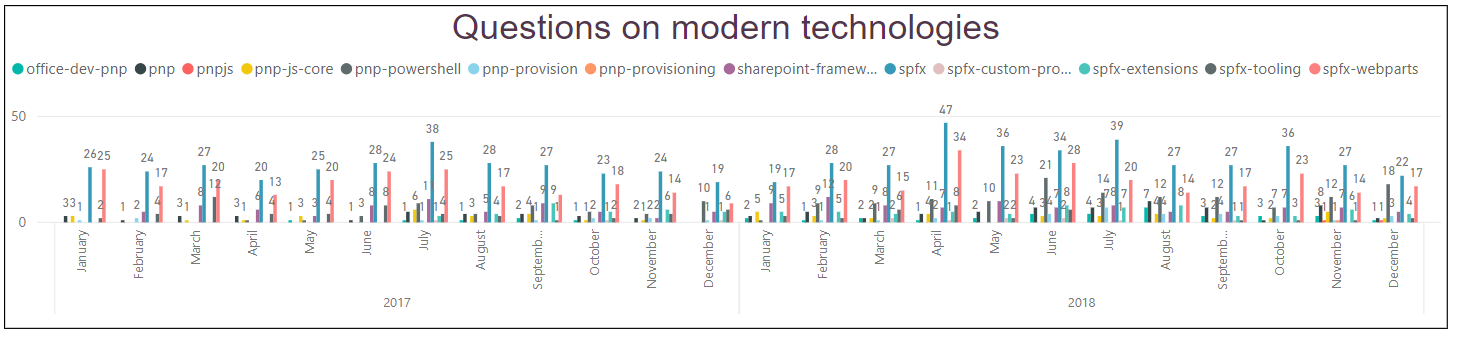](/image.axd?picture=/2019/stack-analysis/questions%20on modern tags.png)
It means that interest is still growing, which is very cool. NOTE: Modern tags are “*pnp*”, “*spfx*”, sharepoint-framework.
Answers
[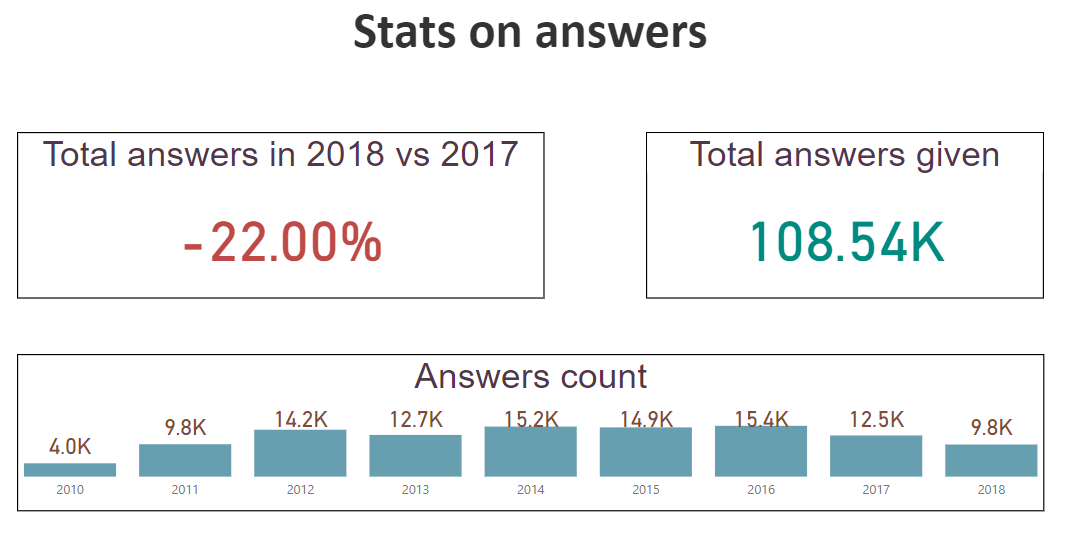](/image.axd?picture=/2019/stack-analysis/stats%20on answers.png)
In 2017 the number of answers decreased by 19%, in 2018 by 22% (when compared with the previous year).
In 2018 users were answering questions 40% less often when compared to 2016.
That’s the reason why we see less number of accepted answers (something I talked above).
Below two charts show how many answers were given (trend) and how many answers were upvoted \ not upvoted. As we already have seen that users activity in 2018 goes down, below charts prove it.
[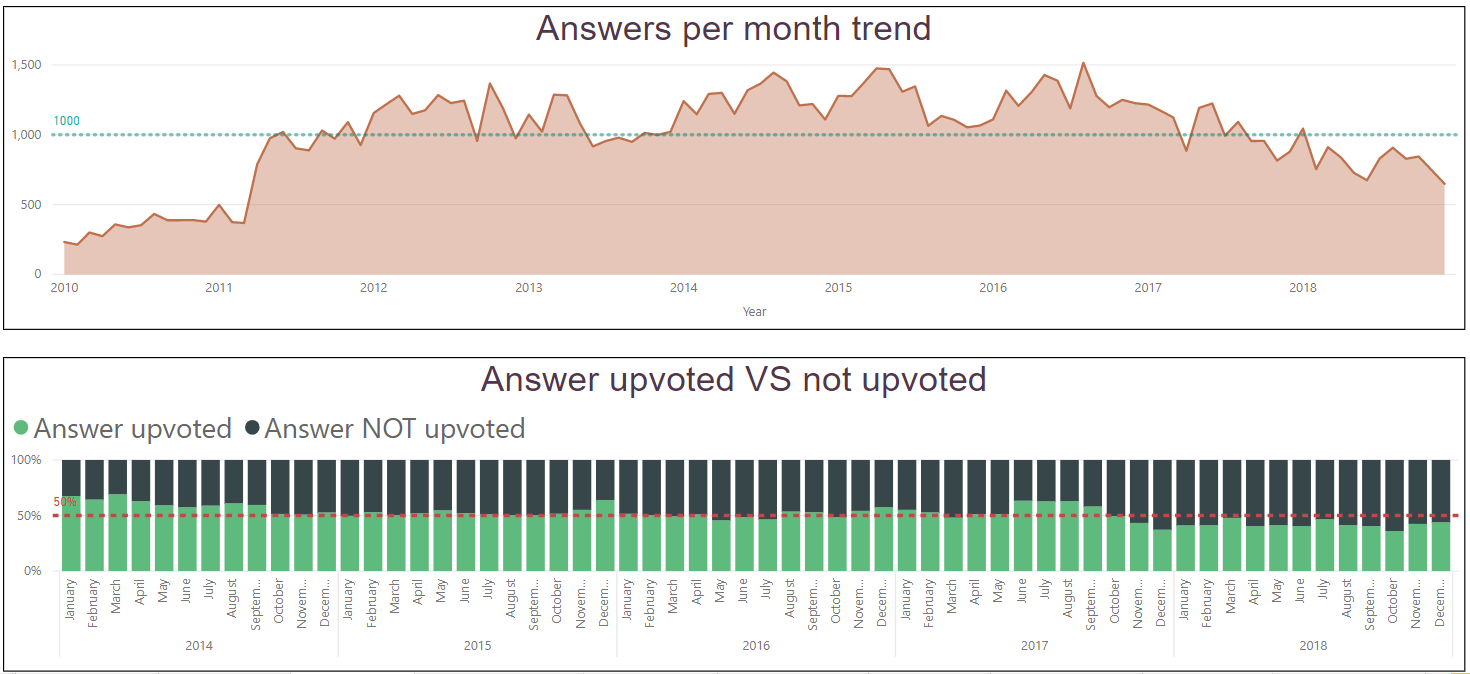](/images/blog/2019/sharepoint-development-state-in-2018-story-based-on-sharepoint-stackexchange-analysis-with-power-bi/answers trends.png)
Based on the chart above we can say that
In 2018 you had less than 50% chance that your answer will be upvoted at least once
Will it be the same in 2019? I think yes and maybe even worse. I can’t see any signs that user activity will grow.
While the level of accepted VS not accepted answer is the same in 2018:
[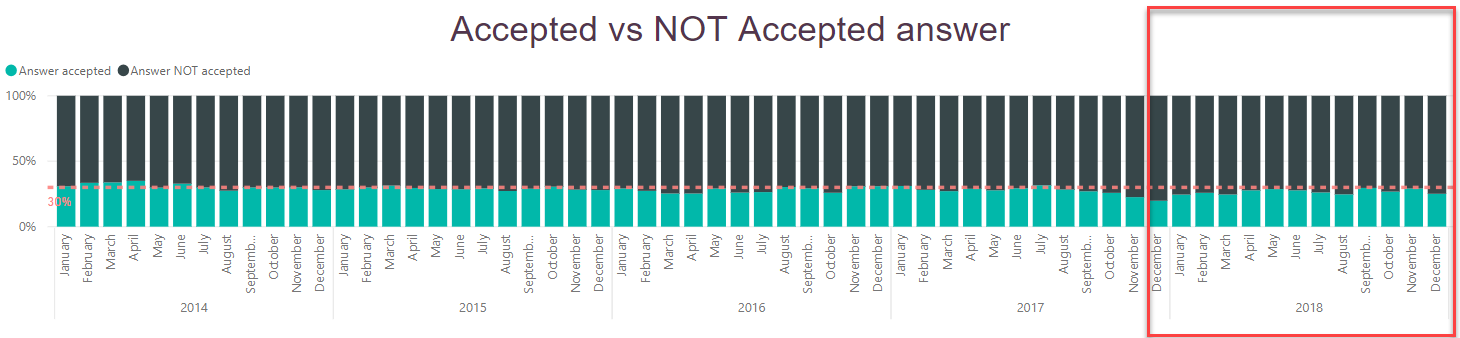](/image.axd?picture=/2019/stack-analysis/accepted%20vs not accepted.png)
Total upvotes received trend goes down:
[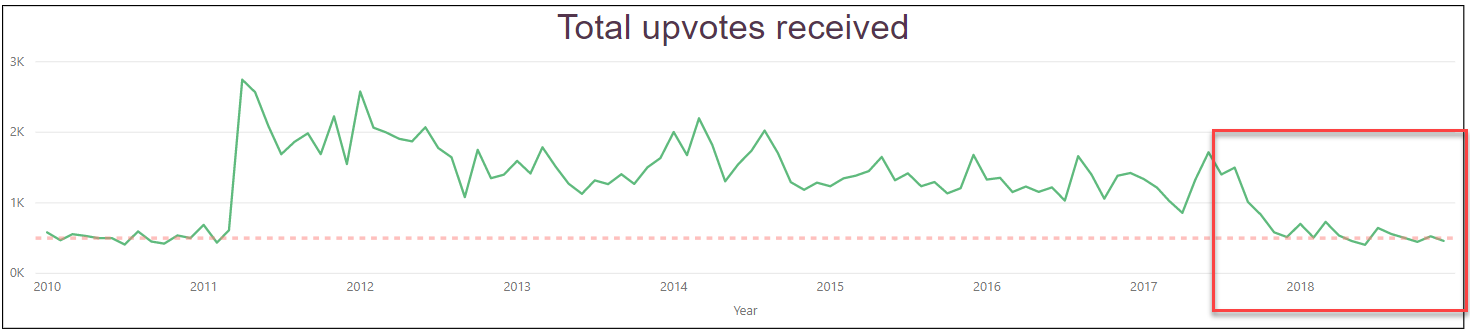](/image.axd?picture=/2019/stack-analysis/total%20upvotes recevied.png)
The amount of upvotes in 2018 goes to the level of 2010-2011, which isn’t good at all because SharePoint StackExchange was launched in 2009. Upvoters leave sharepoint StackExchange. As a result score per answer trend also goes down:
[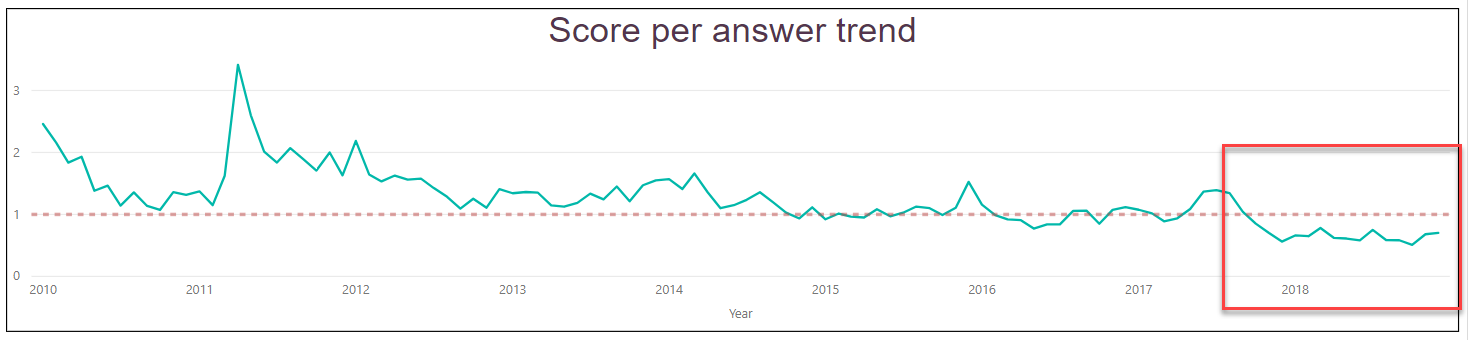](/image.axd?picture=/2019/stack-analysis/score%20per answer.png)
Users
[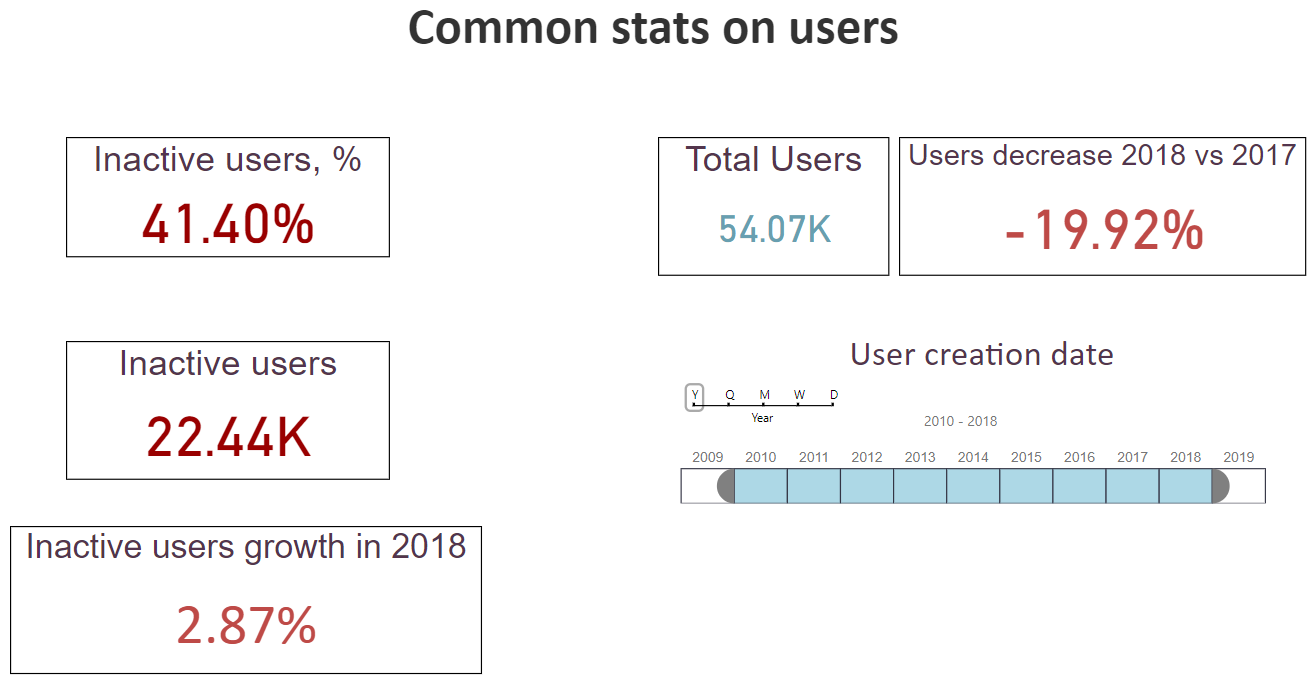](/image.axd?picture=/2019/stack-analysis/common%20users stats.png)
The number of registered users decreased in 2018. There is still a significant amount of inactive users (users who haven’t asked or answered and haven’t upvoted or downvoted).
The trend for registered users is below (take a note on growth until 2017):
[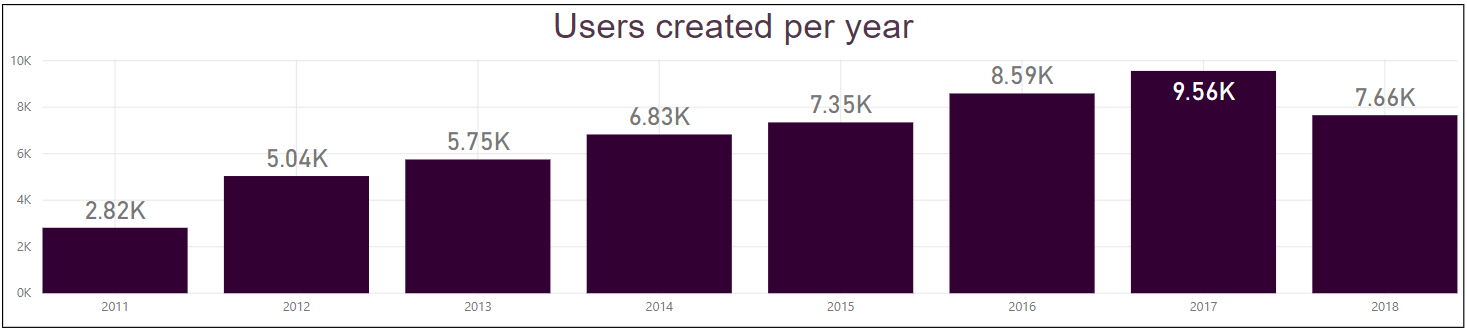](/image.axd?picture=/2019/stack-analysis/users%20created per year.png)
Let’s explore users activity when it comes to answering on questions.
How many answers a user gives? Below chart demonstrates that:
[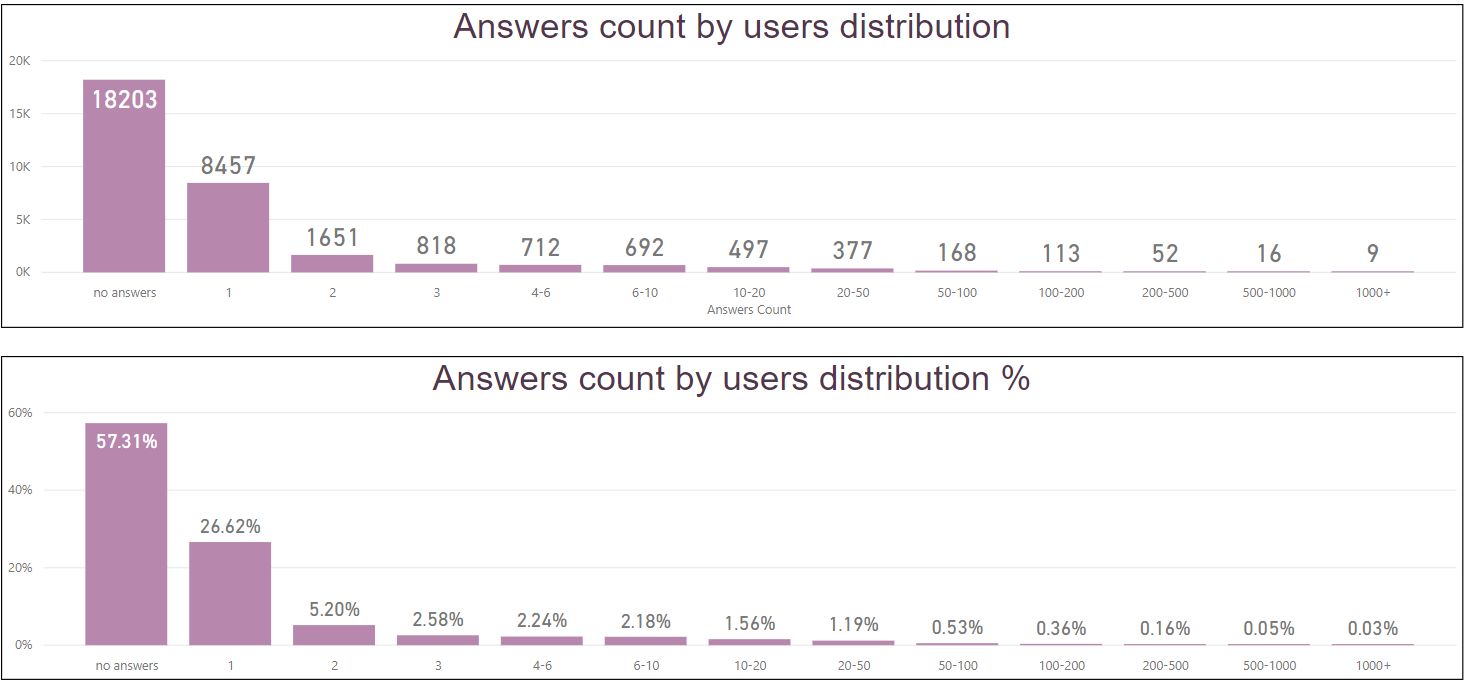](/image.axd?picture=/2019/stack-analysis/answers%20by count of users.png)
How to read it? For example in the top chart: 8457 users have only 1 answer.
9 users have more than 1k of answers!
57% of all users haven’t provided any answers
Checkout upvote trends as well:
[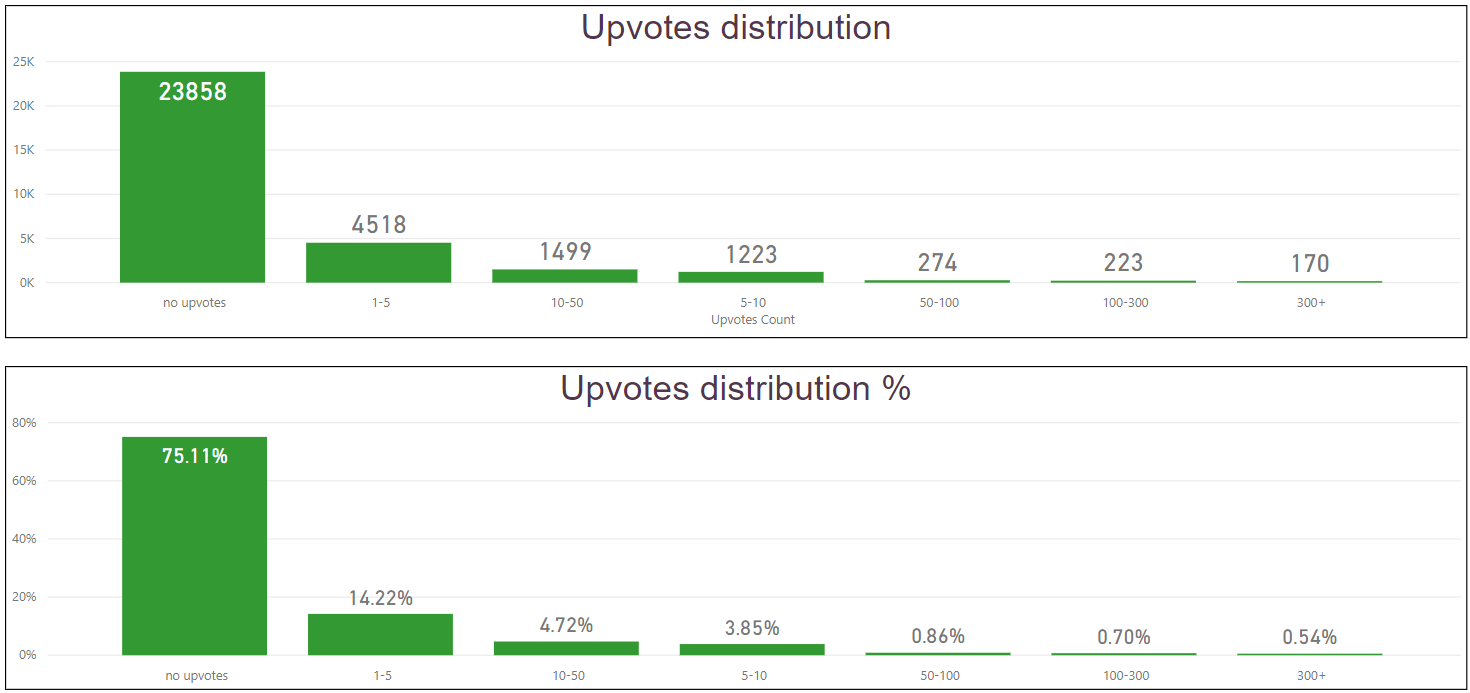](/images/blog/2019/sharepoint-development-state-in-2018-story-based-on-sharepoint-stackexchange-analysis-with-power-bi/upvotes trends.png)
75% of all users have never upvoted
From which countries users were coming from in 2018? Here you go:
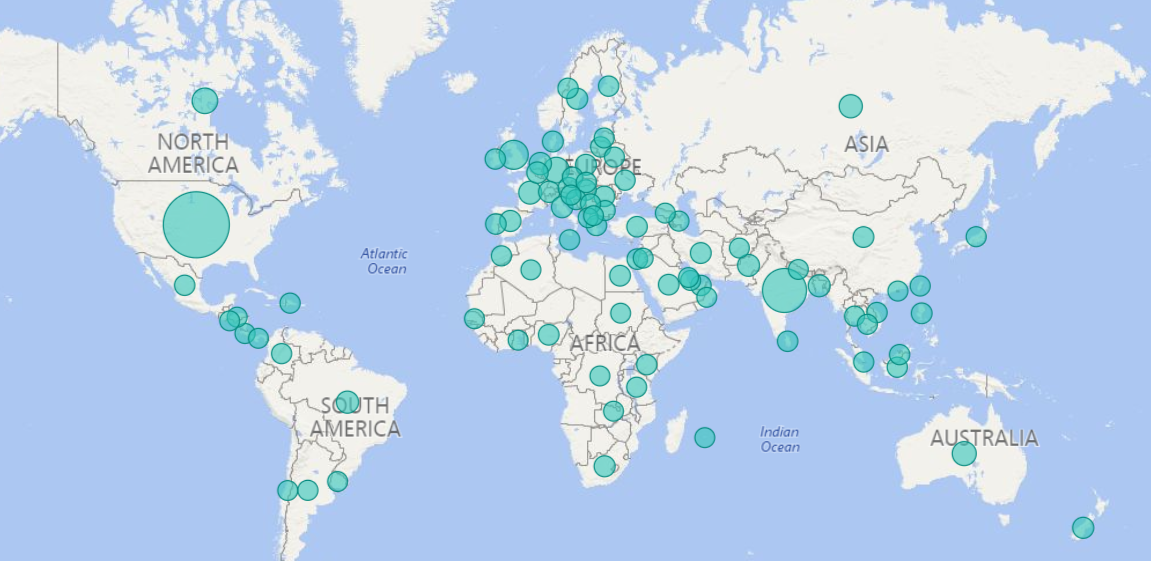
A lot of users came from the USA, Europe and India. Here is a detailed Europe map:
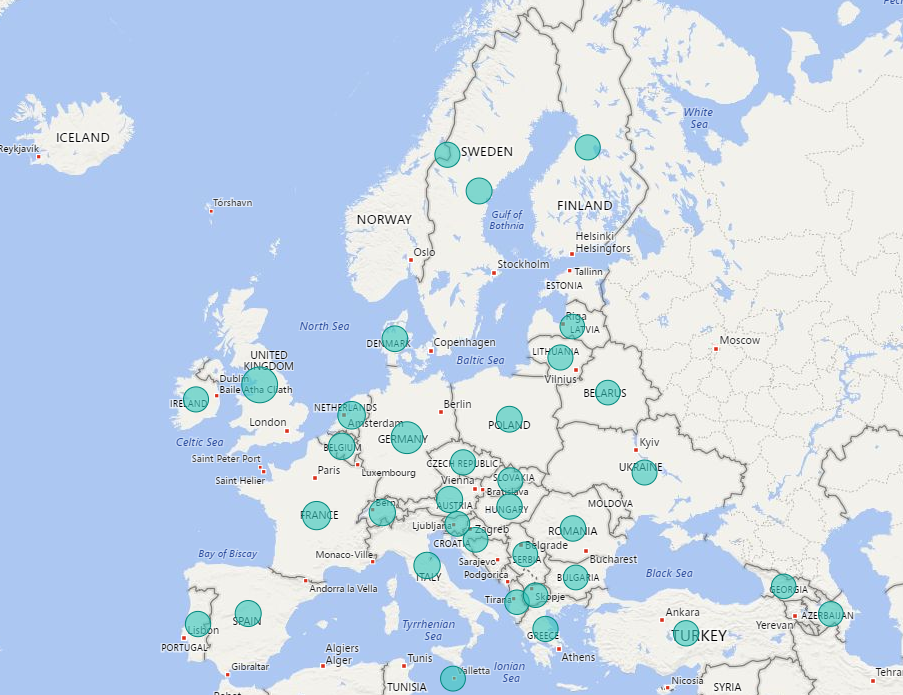
[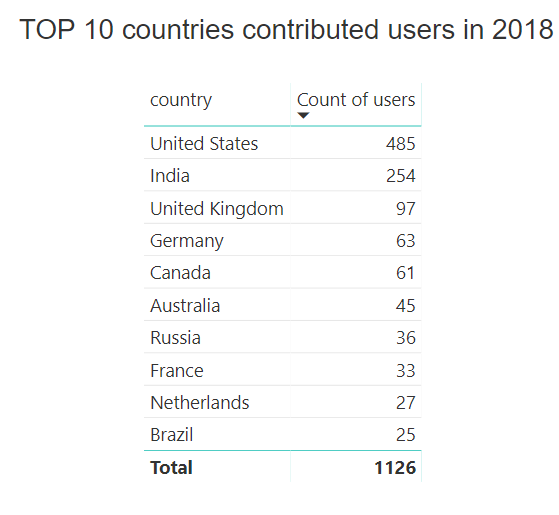](/image.axd?picture=/2019/stack-analysis/top%2010 countries.png)
TOPS (all time)
[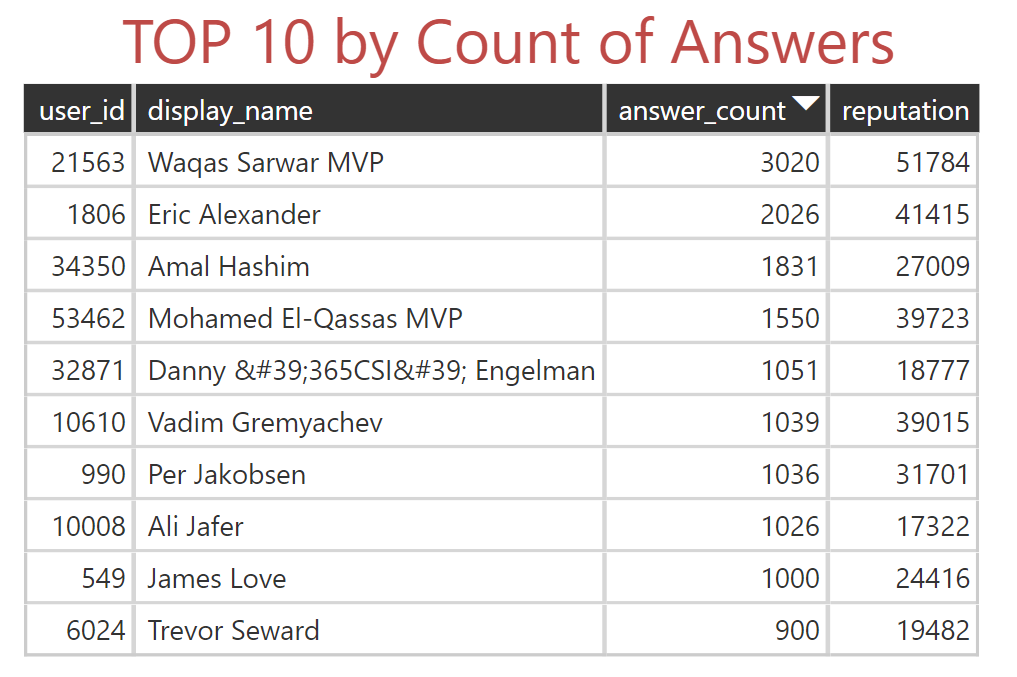](/image.axd?picture=/2019/stack-analysis/top%2010 by answer count.png)
Waqas Sarwar reached 3k answers! That’s an absolute record! Congratulations Waqas!
[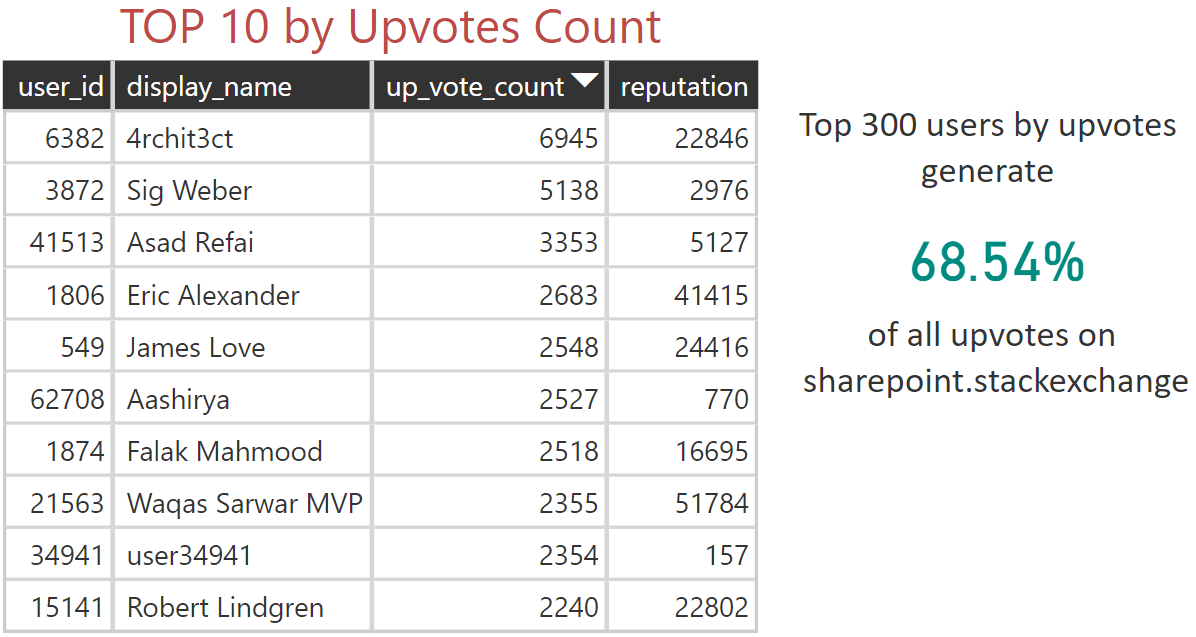](/image.axd?picture=/2019/stack-analysis/top%2010 by upvotes.png)
The situation hasn’t changed since 2017 here. Almost the same for TOP 10 users by reputation:
[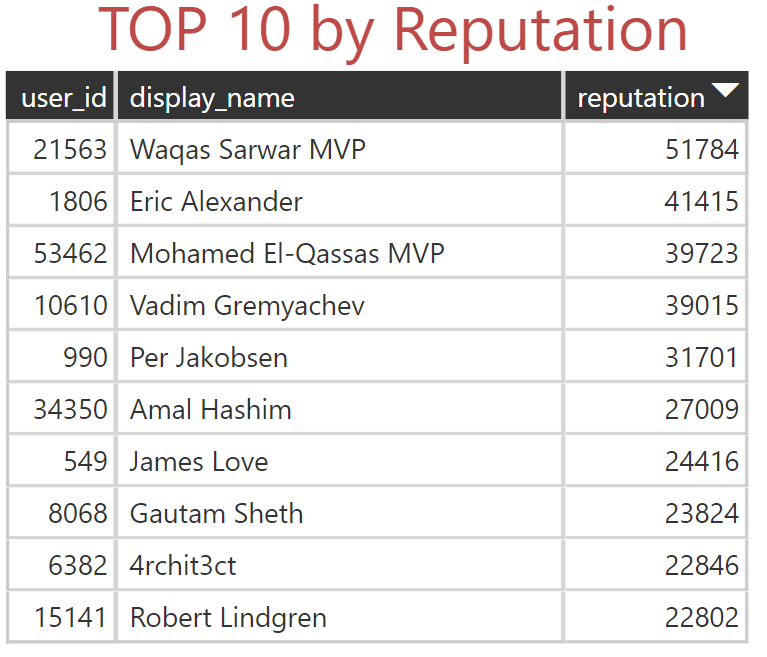](/image.axd?picture=/2019/stack-analysis/top%2010 by reputation.png)
However, we have new stars here - Gautam Sheth and Mohamed El-Qassas [MVP]. They did an unbelievable job and managed to climb in TOP 10 in approximately 3 years! (Mohamed El-Qassas was in TOP in the last year as well). Congratulations! Great work!
Next picture:
[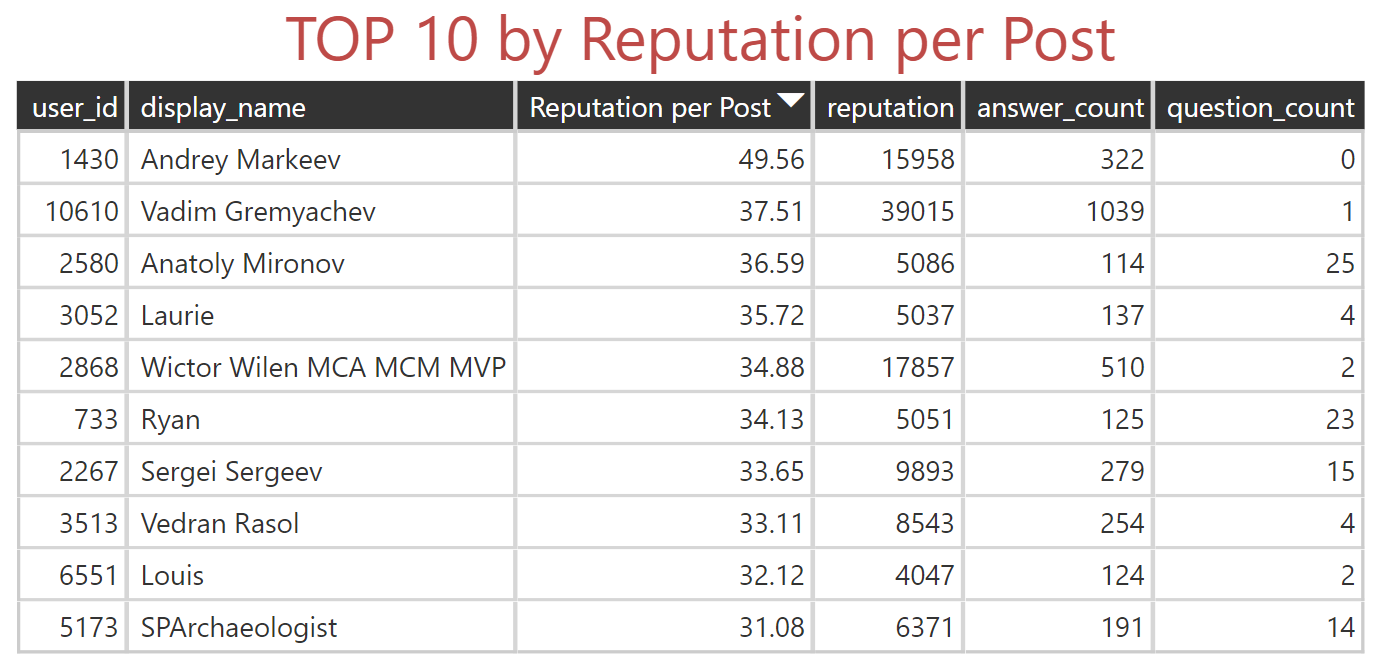](/image.axd?picture=/2019/stack-analysis/top%2010 by reputation per post.png)
It shows how many reputations a user gains per one post (answer or question). Whorray! I managed to stay in this top :)
Another interesting parameter is an impact:
Estimated number of times people viewed your helpful posts (based on page views of your questions and questions where you wrote highly-ranked answers)
In other words, this param indicates how often your questions and highly-ranked answers were viewed by other people. Be default SE API doesn’t provide such information, so I had to grab it using nice and easy to use nodejs module called osmosis. Here are our TOP users by impact:
[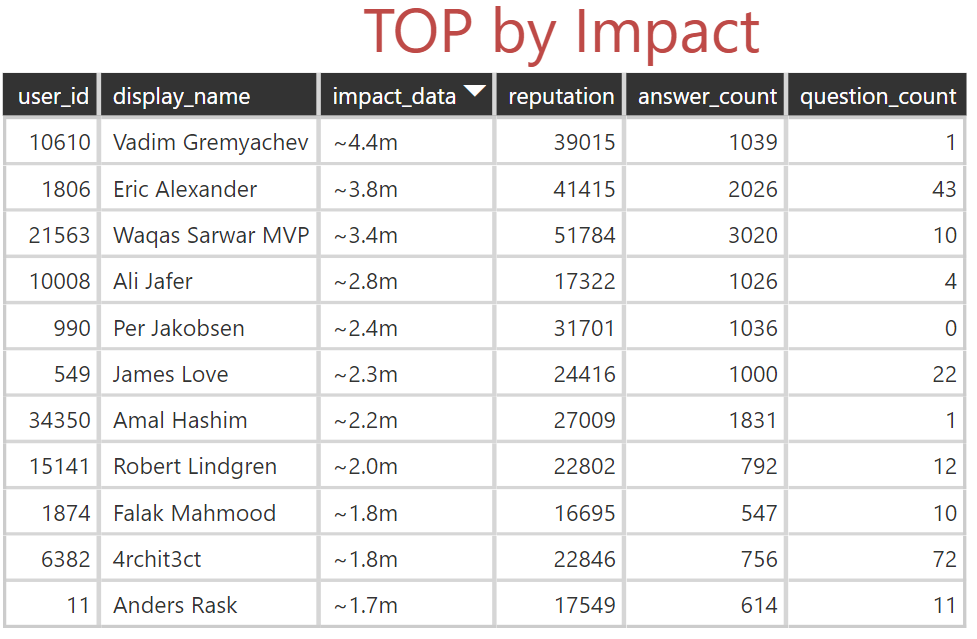](/image.axd?picture=/2019/stack-analysis/top%20by impact.png)
Another interesting table we can build using impact data is impact gained per post. It means how many users viewed your answer (or question). Calculated per post, it shows users with the most impactful posts:
[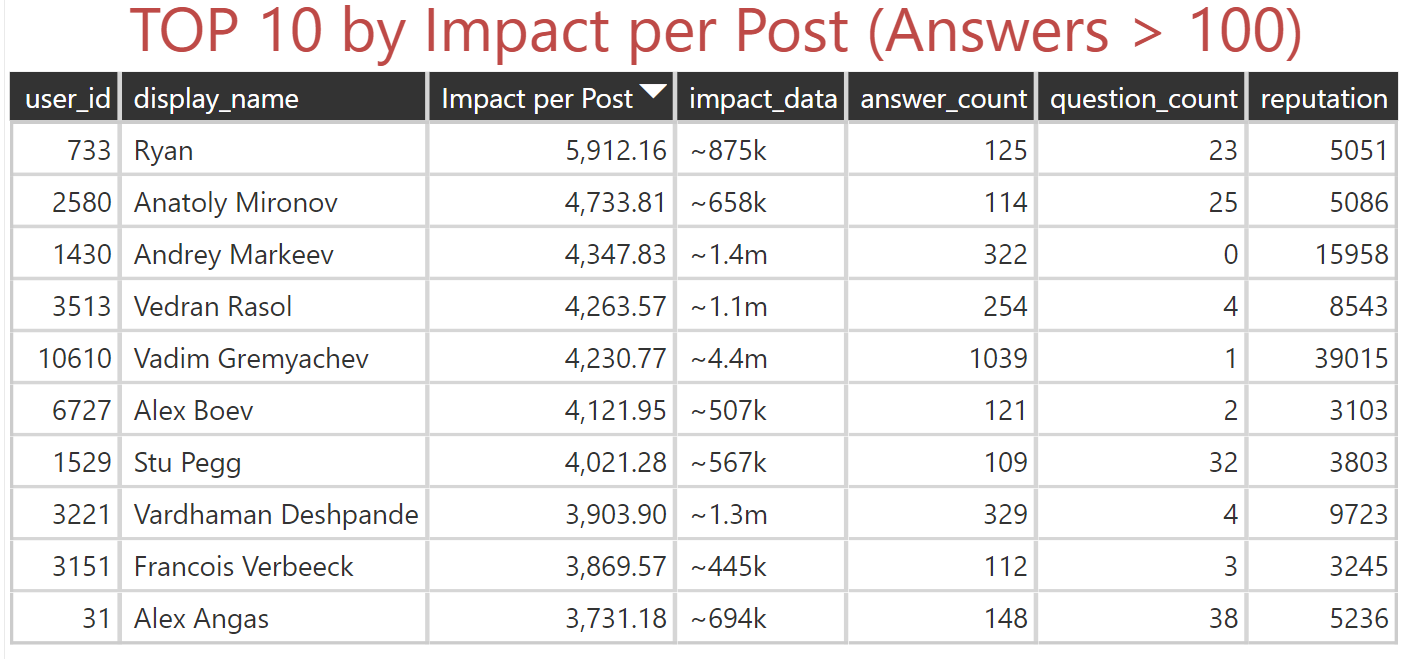](/image.axd?picture=/2019/stack-analysis/top%2010 by impact per post.png)
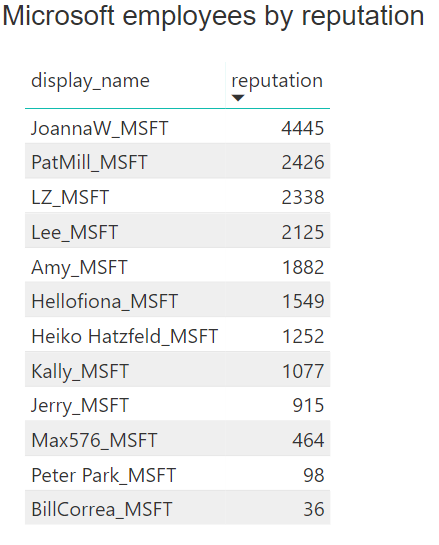
Microsoft
This year I noticed a lot of answers from users with “_MSFT” ending. I assume they are full-time Microsoft employees. And they do a great job by answering a lot of questions! That was not a case in 2017, but something changed in 2018. I guess Microsoft found a budget to help people on sharepoint.stackexchange as well.
[](/images/blog/2019/sharepoint-development-state-in-2018-story-based-on-sharepoint-stackexchange-analysis-with-power-bi/msft reputation.png)
Check out how many answers Microsoft employees gave in 2018:
[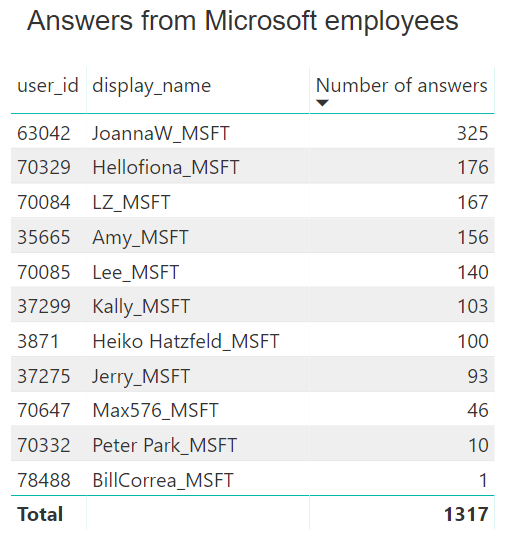](/images/blog/2019/sharepoint-development-state-in-2018-story-based-on-sharepoint-stackexchange-analysis-with-power-bi/msft 2018.png “Answers from MSFT in 2018”)
When compared with the total number of answers in 2018, it gives us
[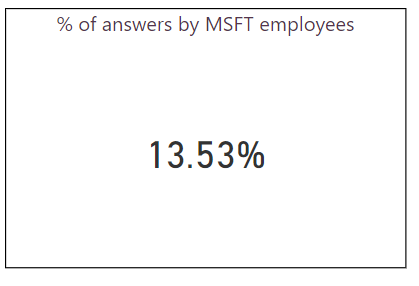](/images/blog/2019/sharepoint-development-state-in-2018-story-based-on-sharepoint-stackexchange-analysis-with-power-bi/msft percent.png ”% of answers in 2018”)
which is a significant amount.
If we select our TOP 10 users in 2018 by number of answers, sum all their answers, it will give us
[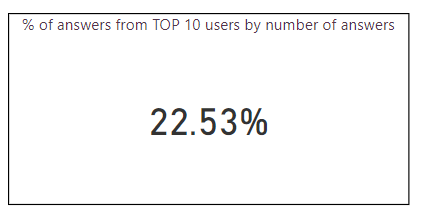](/images/blog/2019/sharepoint-development-state-in-2018-story-based-on-sharepoint-stackexchange-analysis-with-power-bi/top percent.png)
TOP 10 users (by answers count) together with Microsoft provide 35% of all answers on sharepoint.stackexchange.com
Conclusion
We see that activity on sharepoint.stackexchange slowly goes down in 2018. Less number of registered users, fewer answers, fewer questions. This tendency started approximately in September-November 2017. There may be many reasons for this. Which one is the most common in your opinion?
The stats on answers (accepted \ answered \ not answered) are also not very good. This year Microsoft helped with lots of answers, probably that’s the reason why the green line in questions state trend is still under the red one. However it looks like the reason if it is that activity in general slowly goes down in 2018.
I will do the report at the beginning of the next year, we’ll see how things change in 2019.