Last year I was learning Power BI via sharepoint.stackexchange analysis, the year is over, it’s time to perform similar analysis on 2017 year! Just a reminder, that everything in this post built with great tool Power BI Desktop and Stack Exchange API as data source. Some advanced data was collected with help of Google Maps Geocode API and nodejs webpages scrapper – osmosis. The source code is available on my github repository.
NOTA: all thoughts here are just my thoughts and may be incorrect or not aligned with yours. Please, share your opinion in comments.
This year I concentrated on verification of some trends from 2016 and mostly on data comparison between 2016 and 2017. So let's get started!
The first difference in the report from the 2016 year, that this time you can try it! You can play with data, change filters, dates and see the actual result. I’ve published all reports to Power BI account (hopefully now I have one as part of my MVP benefit).
Please use this link to see the actual report and play with it.
Or download the report with data from here (zip, 46.45 mb) and play locally.
In the beginning, let's take a look at some changes in tags:

Compare it with questions with tags in 2017:

SharePoint Online becomes trending tag on sharepoint.stackexchange
You can see, that SharePoint Online becomes a tendency, sharepoint-enterprise and 2013 tags become smaller.
In the next few pictures, we’ll take a closer look at questions, answers, users and their trends. Stay tuned! :)
Questions
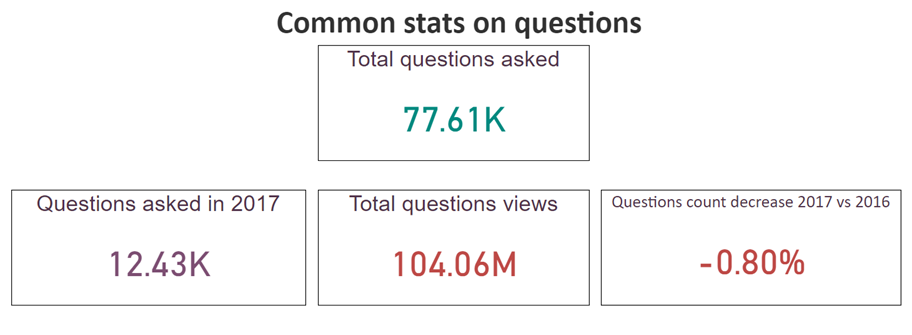
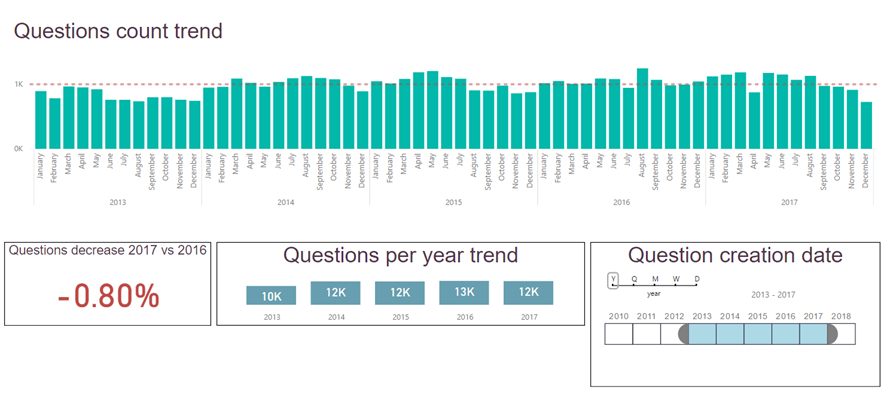
In 2017 users asked almost 12.5k questions, which is however slightly smaller than in 2016. Nothing interesting here let's go further.
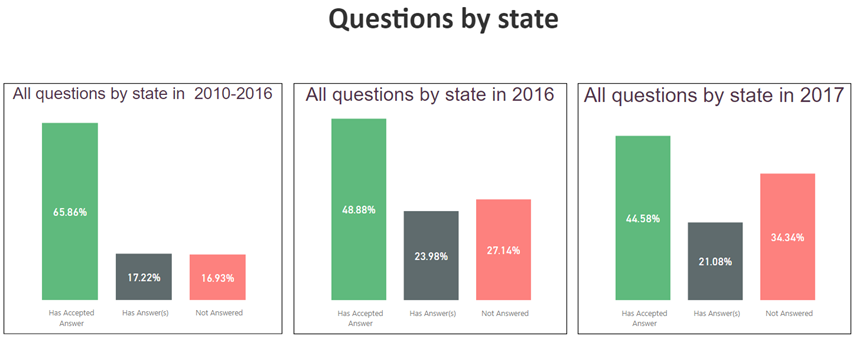
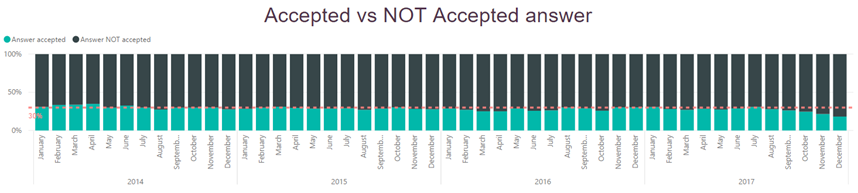
In 2017 we can see that the number of accepted answers continues to decrease. The number of not answered questions is bigger. However some questions will be answered in 2018, so in next year this stats will be a bit better. Bad news, that this is a tendency and every year number of accepted answers decreases. Below picture also proves it:
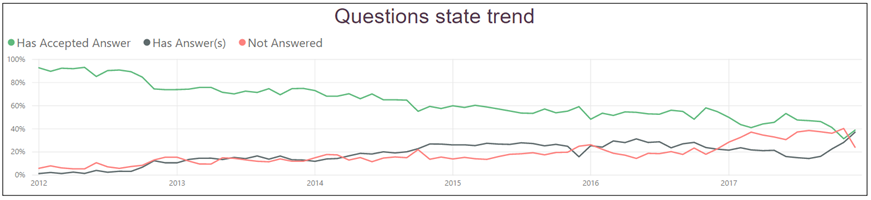
November 2017 is the first month when number of unanswered questions was greater than number of questions with accepted answer.
We’ll see if the situation will be improved in 2019. I was thinking about the reason for it and I believe that some users tend to look for an answer on other sites or services (like MS techcommunity, GitHub). However, a number of questions per year are almost the same across all years:
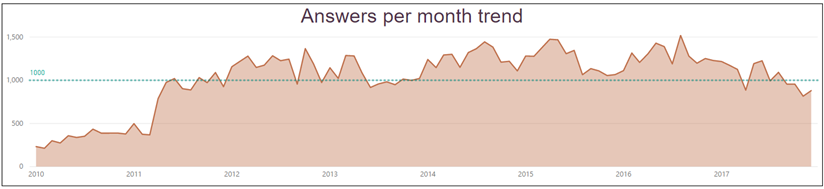
The other reason for decreasing number of accepted answers that there are fewer people who answer on questions than it was before. Questions become too specific and it’s difficult to give a precise answer (there are so many new things came to SharePoint and Office 365 in recent years!). Below graph prove it:
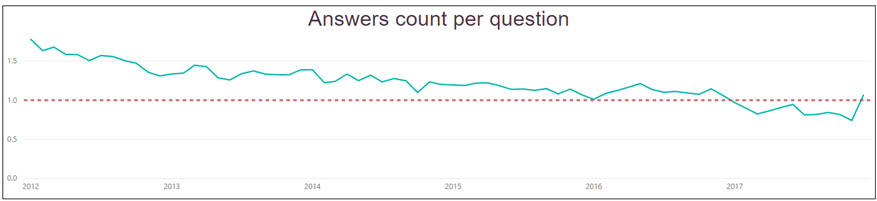
In recent years users tend to answer less often
InfoPath anomaly
Now I officially call it InfoPath anomaly:
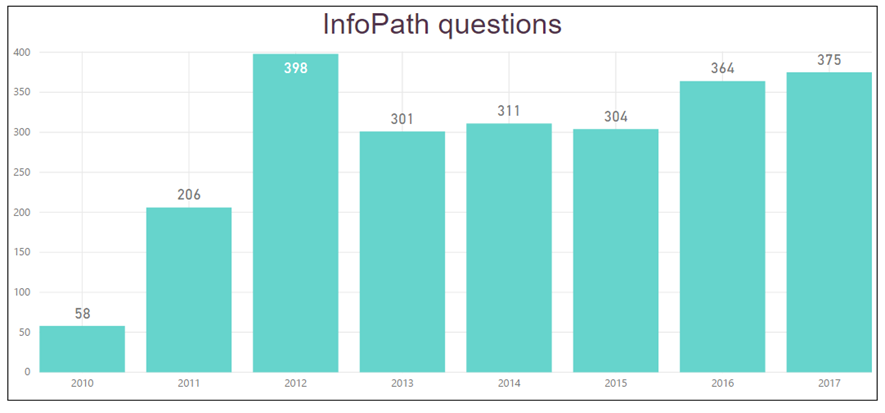
I don’t know why, but every year there is a significant number of InfoPath questions and it's not going to be smaller. Take a look at Google trends (InfoPath terms):
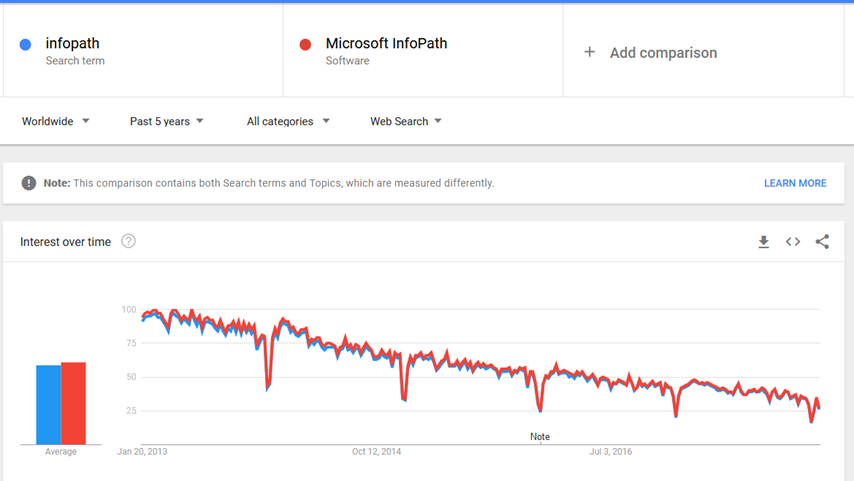
I’m writing to Google saying that their trends are lying.
Ok, enough InfoPath, let’s take a look at something modern.
Modern trends
In 2017 people asked a lot more questions on spfx-* and pnp-* topics:
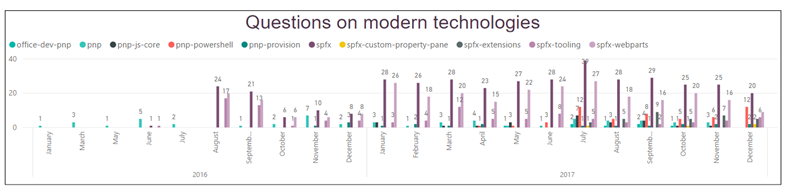
That’s a good tendency and that’s a marker for you to start learning SPFx (if not learned yet) and different PnP tools and libraries.
Answers
It’s time to a closer look at answers. First of all, consider below data:
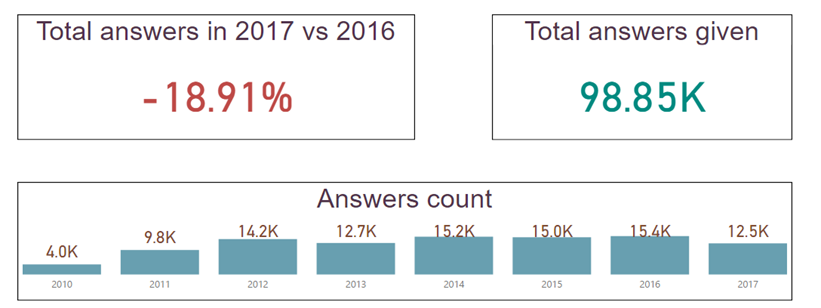
You see?
In 2017 users gave 19% less answers than in 2016
That’s why we saw a decreasing number of accepted answers as well. Because there are less answers in total for the whole year. I’m counting answers given in 2017, meaning that number won’t be increased in future. Again, let’s take a note and see things in 2019.
Some more fancy graphs around answers:
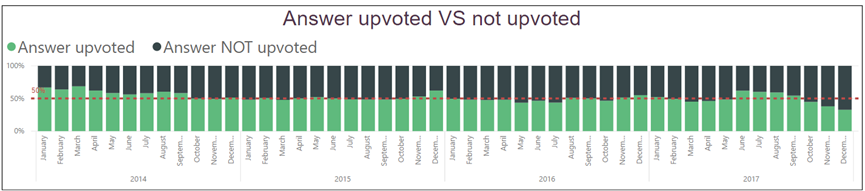
A number of upvoted answers is slightly decreased in 2017. However, below is still true:
If you give an answer, that’s 50% chance that your answer will be upvoted at least once
This trend is almost the same as for 2016. However, if you look closely to October, November and December (as well on previous pictures). Those months are strange because they show a strong decrease in the number of questions and answers, I don’t know why last year trend doesn’t show any decrease at the end of the year. Maybe you know, give your ideas in comments.
The same applies to score per answer trend:

At the end of the year, it becomes extremely low.
Users
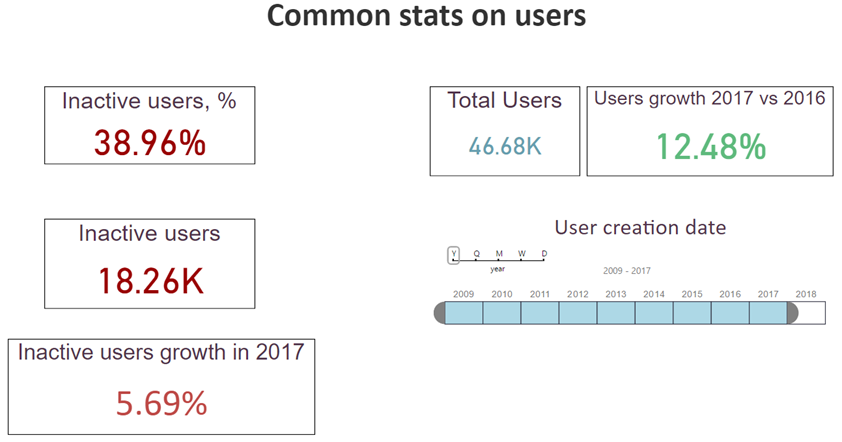
As for 2016, the number of inactive users is still big. Inactive users are those users who have zeros in statistics by questions, answers, upvotes and downvotes. They are like bots. In 2017 we have even more inactive users.
39% of all users didn’t ask or answer a question, as well as didn’t upvote or downvote
Here are some other interesting user trends:

Below three charts show overall user activity in different areas. First of all, take a look at this one:
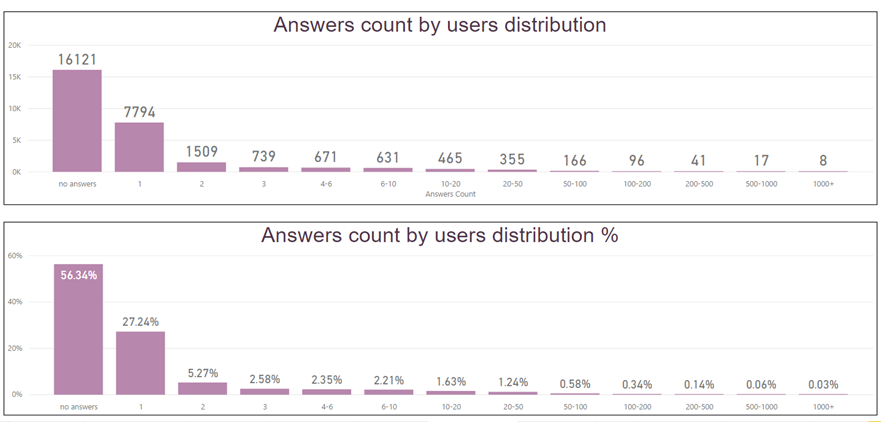
How to read it? It means, for example, that 27.24% of all users have only one answer. 56.34% don’t have answers and only questions (how many answers the user has, x-axis – count of answers, y – count of users). Nothing changed in 2017:
84% of all users have 0-1 answer on sharepoint.stackexchage
However in the 2017 year 8 users have more than 1k of answers! Great and hard work, thank you!
Below trend is a similar, although shows the same stats but for questions (how many questions the user has, x-axis – count of questions, y – count of users)
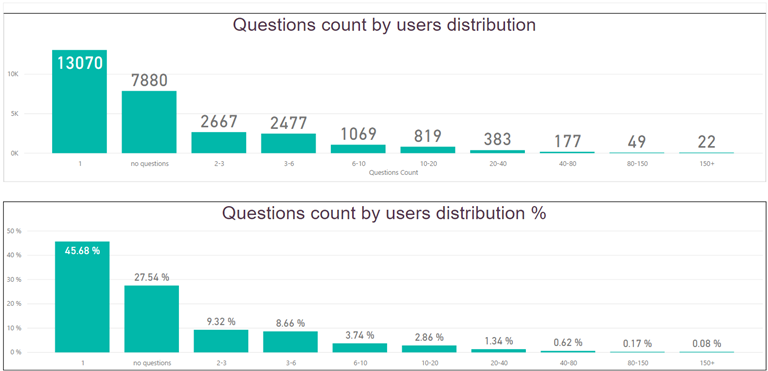
Situation is the same as for 2016:
72% of all users have 0-1 question on sharepoint.stackexchange
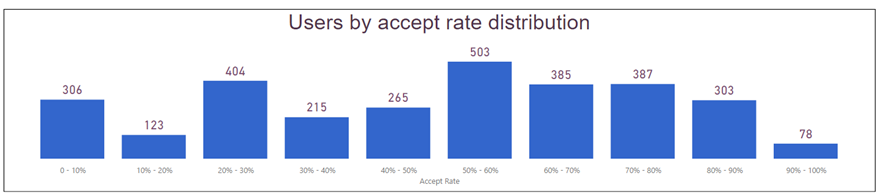
And finally upvotes distribution (how many upvotes user has, x-axis – count of upvotes, y – count of users):
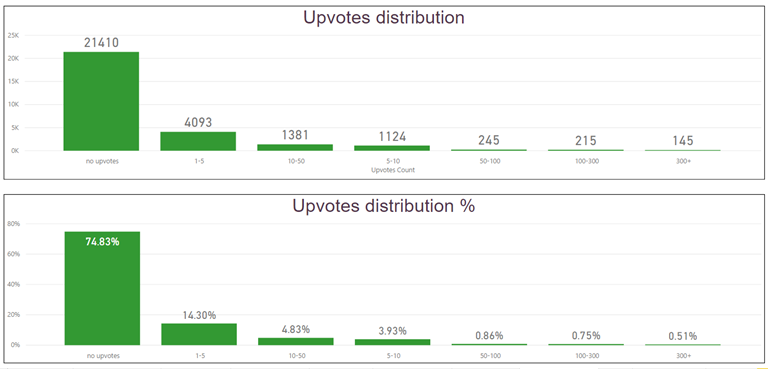
Again, as in the previous year, only a small amount of people generate a huge amount of total upvotes.
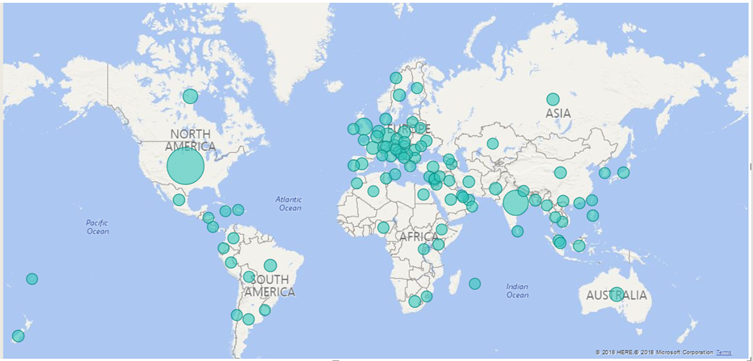
And here is a map with user distribution across countries, which registered in 2017:
Tops (all time)
And finally our stats on top users all the time.
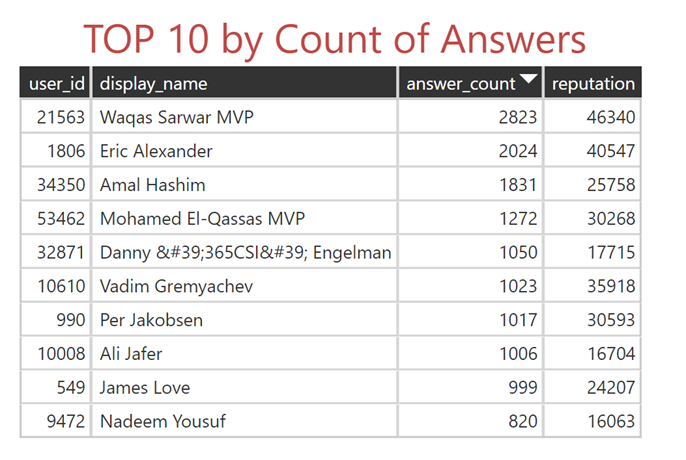
Waqas Sarwar is absolute leader here, really impressive stat (the same actually goes for everybody in the table).
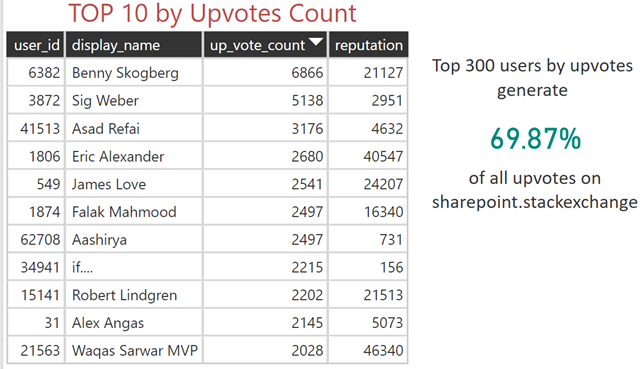
Benny Skogberg is top upvoter here. Benny, thank you, I’m pretty sure you also upvoted my answers somewhere in the past :)

Wagas Sarwar is also leader here, however, Eric Alexander is not so far away! We’ll see stats in 2019 :)
That’s also one interesting attribute inside user profile called impact. When you click on the user profile, you will this attribute (people reached):

Stack Exchange explain it as
Estimated number of times people viewed your helpful posts (based on page views of your questions and questions where you wrote highly-ranked answers)
In other words, this param indicates how often your questions and highly-ranked answers were viewed by other people. Be default SE API doesn’t provided such information, so I had to grab it using nice and eaysy to use nodejs module called osmosis. Here is our TOP users by impact:
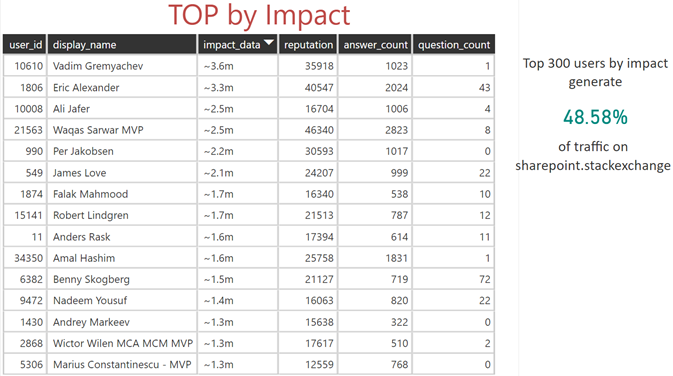
Last year Eric Alexander and Vadim Gremyachev were fighting for first place. This year Vadim is TOP 1 in this list with an impressive 3.6 millions of impact. Eric also has reached more than 3 millions.
Below table shows who is the most effect user in terms of reputation per post:
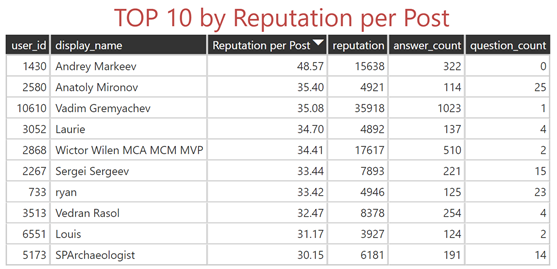
Congratulations to Andrey Markeev who is the leader here :)
The End!
That was 2017. In 2017 we see that count of questions remains almost the same in comparison to 2016, however, there are much more registered users. Unfortunately, in three last months of 2017, the number of answers and questions decreased.
As usual, thank you all for you great questions and of course for your valuable answers! I know how hard is it.
Again, here the link to report.