Office365 family provides a lot of services for you and your organization. In recent weeks I was playing \ working with some of them like Power BI and MS Flow.
I wrote an article about sharepoint.stackexchange analysis with Power BI. Power BI is a great tool for data analysis. With Power BI Desktop you can create great visualizations of your data and share it with your colleagues or publish on the web. It nicely integrates with modern SharePoint Online as well.
MS Flow provides a way to automate a lot of different processes and simplify business cases. It also a very powerful tool in a different area - process automation. How to combine all of them and build something useful, engaging and interesting? That's the question I came up when I was working with these tools. Well, there are a lot of options available. It all depends on your imagination or concrete business case. I ended up with an interactive feedback analysis system.
Feedback Analysis System
The system itself is fairly simple and common:
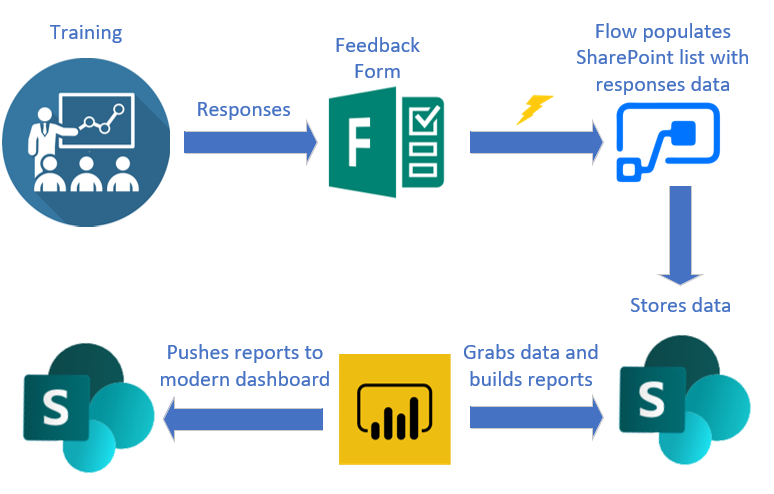
- Imagine an organization, which regularly holds training sessions inside the company (or outside, it doesn't really matter).
- Once training is completed, all attendees fill in a feedback form using MS Forms.
- Upon feedback form completion a Flow is triggered and fills in SharePoint list with data from feedback form.
- Power BI dashboard uses SharePoint list data to build a different kind of reports.
- The dashboard is published and available in modern SharePoint through the Power BI web part.
Below image demonstrates the scheme:
Feedback form
You can access the form using this link.
You can fill in it and the data will be available in Power BI report later on (currently the data is refreshed once a day, however, it can be changed up to 9 times a day). Basically, you select the training name and answer a few questions based on your experience with the training. The questions are about the training itself, about the trainer, materials, etc.
SharePoint lists
There is a list with training feedback responses and a list with all training sessions. Feedback list has a lookup to the Trainings list.
The Flow
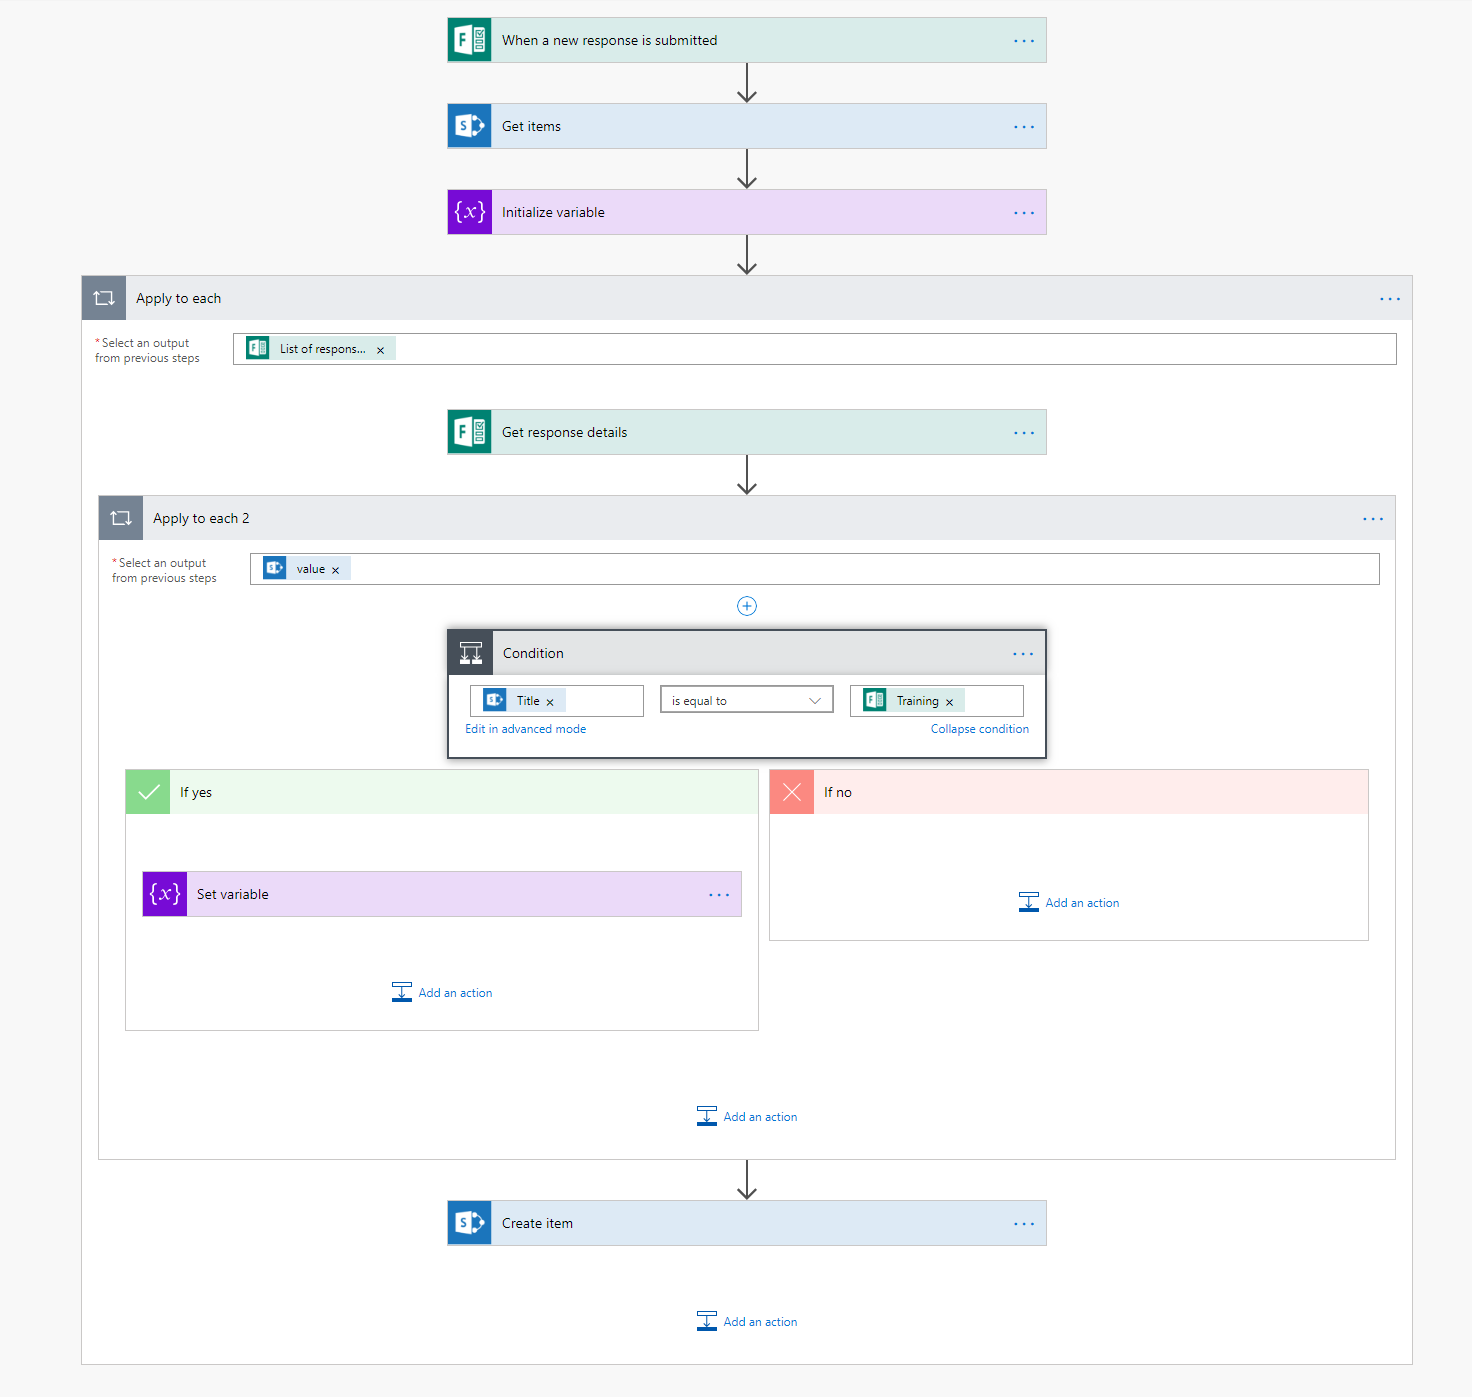
How it works:
- When a new response is submitted it gets all training names from the Trainings list and initializes a variable TrainingId.
- For every new response, it searches for a corresponding item from the Trainings list (by title) and stores it in a variable TrainingId.
- Creates a new SharePoint item with TrainingId lookup and data from feedback form fields.
You can even further extend this example and analyze sentiment in text responses using Azure services and include it in stored data as well.
Power BI
Now as we have the data, we are not limited in data analysis. I said it before but I will say it again. Power BI is an extremely powerful tool. You can literally build any type of report. If you don't have a report or visual you need, you can search it in the online store or even create your own with (guess what?) TypeScript!
The report is published on the web. Use this link to access it or simply see it in action at the animation below:
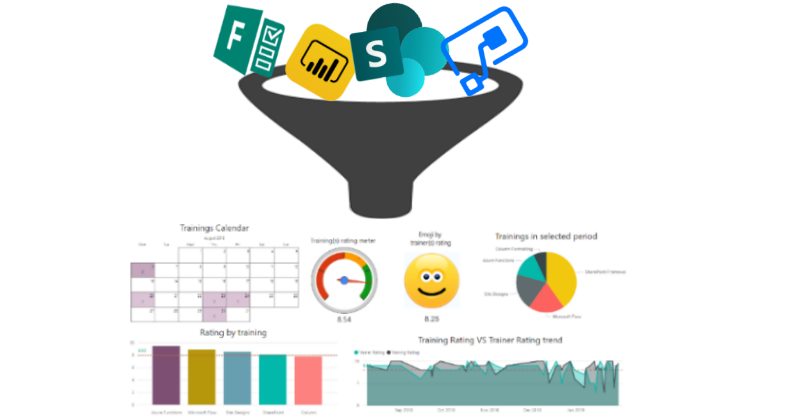
Features:
- Filters by training name, trainer and date periods. Filters dynamically affect all visuals.
- Shows past training sessions calendar. You can click to show data on a specific date.
- Training meter uses gauge visuals to show how good is a rating on training sessions (training sessions are filtered based on dates and slices in the top)
- Dynamic Emoji shows attendees satisfaction with a trainer. A rating of less than 5 is bad, 5-7 normal, 7-9 good and more than 9 is a star. You can filter to SharePoint Framework, select January in dates filter and go from 28 to 31th of January to see it in action.
- Rating by categories, Training Rating VS Trainer Raring trend, a bar chart with training in a selected period
That's only a small subset of what you can analyze with Power BI. As said, you can fill in the feedback form and see your results in this dashboard (the data will be available on the next day, I haven't changed the default data refresh period).
SharePoint Dashboard
Setting up a SharePoint dashboard is very straightforward. Edit a page, add Power BI web part and set the link to point to your Power BI report. The link could be copied from Power BI interface.
Conclusion
I created this sample solution to demonstrate what is possible with Office 365 services today. Of course, that's just one small example, there are tons of other real-world scenarios.
However, was it possible to do something like that 2-3 years ago? Well, yes, but with custom coding. The great thing that today a business user or a consultant without development skills are able to create an end-to-end solution for business. I have a strong feeling that this is the way everything is moving forward today (and not only in Office365). From a lot of coding in the past to no-code business solutions in the future. Of course, to make those solutions you should have well build toolset, like something provided by Office 365.
Also, I think what we are only at the beginning of that way, a lot of new cool things will come in the future to support a lot more sophisticated scenarios. What is your opinion? Share it in comments :)
For your convenience, here is the link to download the flow in .zip format - Feedbacksystem.zip (3.70 kb)