The result
Ingredients
- Microsoft Flow - one piece
- Power BI report - one piece
- Modern SharePoint Power BI web part - one piece
- Mikael Svenson's post - Working with Hub Sites and the search API - one piece
Preparations
Well, actually we don't need any specific preparations. Just have a cup of tea or coffee if you wish :)
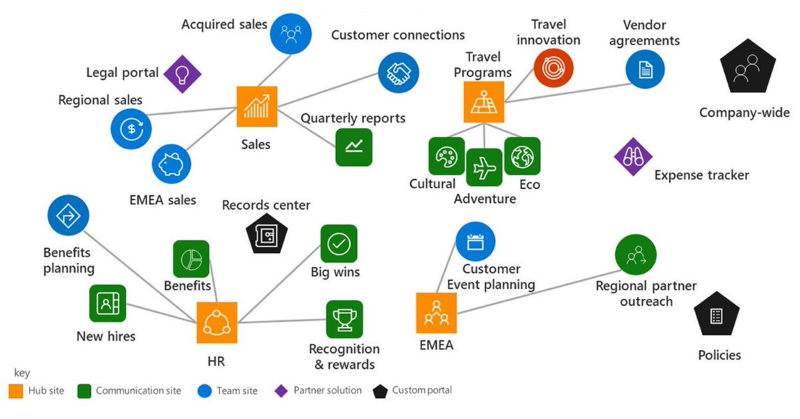
The idea is that we query all hub sites and associated sites into a SharePoint list on schedule using MS Flow. Then we use Power BI with SharePoint as a data source to read hub sites data and visualize it on a report.
The Flow
Create a new list in SharePoint with the only field HubData. Create a recurrent flow, which reads the data about your SharePoint hub sites using Search API. Please refer to Mikael Svenson's post - Working with Hub Sites and the search API to find more info on how to do that. Basically, you should run below query:
HTTP GET

_api/search/query?querytext='contentclass=sts_site'&trimduplicates=false&enablefql=false&rowlimit=1000&selectproperties='Title,Path,DepartmentId,SiteId,IsHubSite'&refinementfilters='departmentid:string("{*",linguistics=off)'&clienttype='ContentSearchRegular'
Check out the full flow available here:
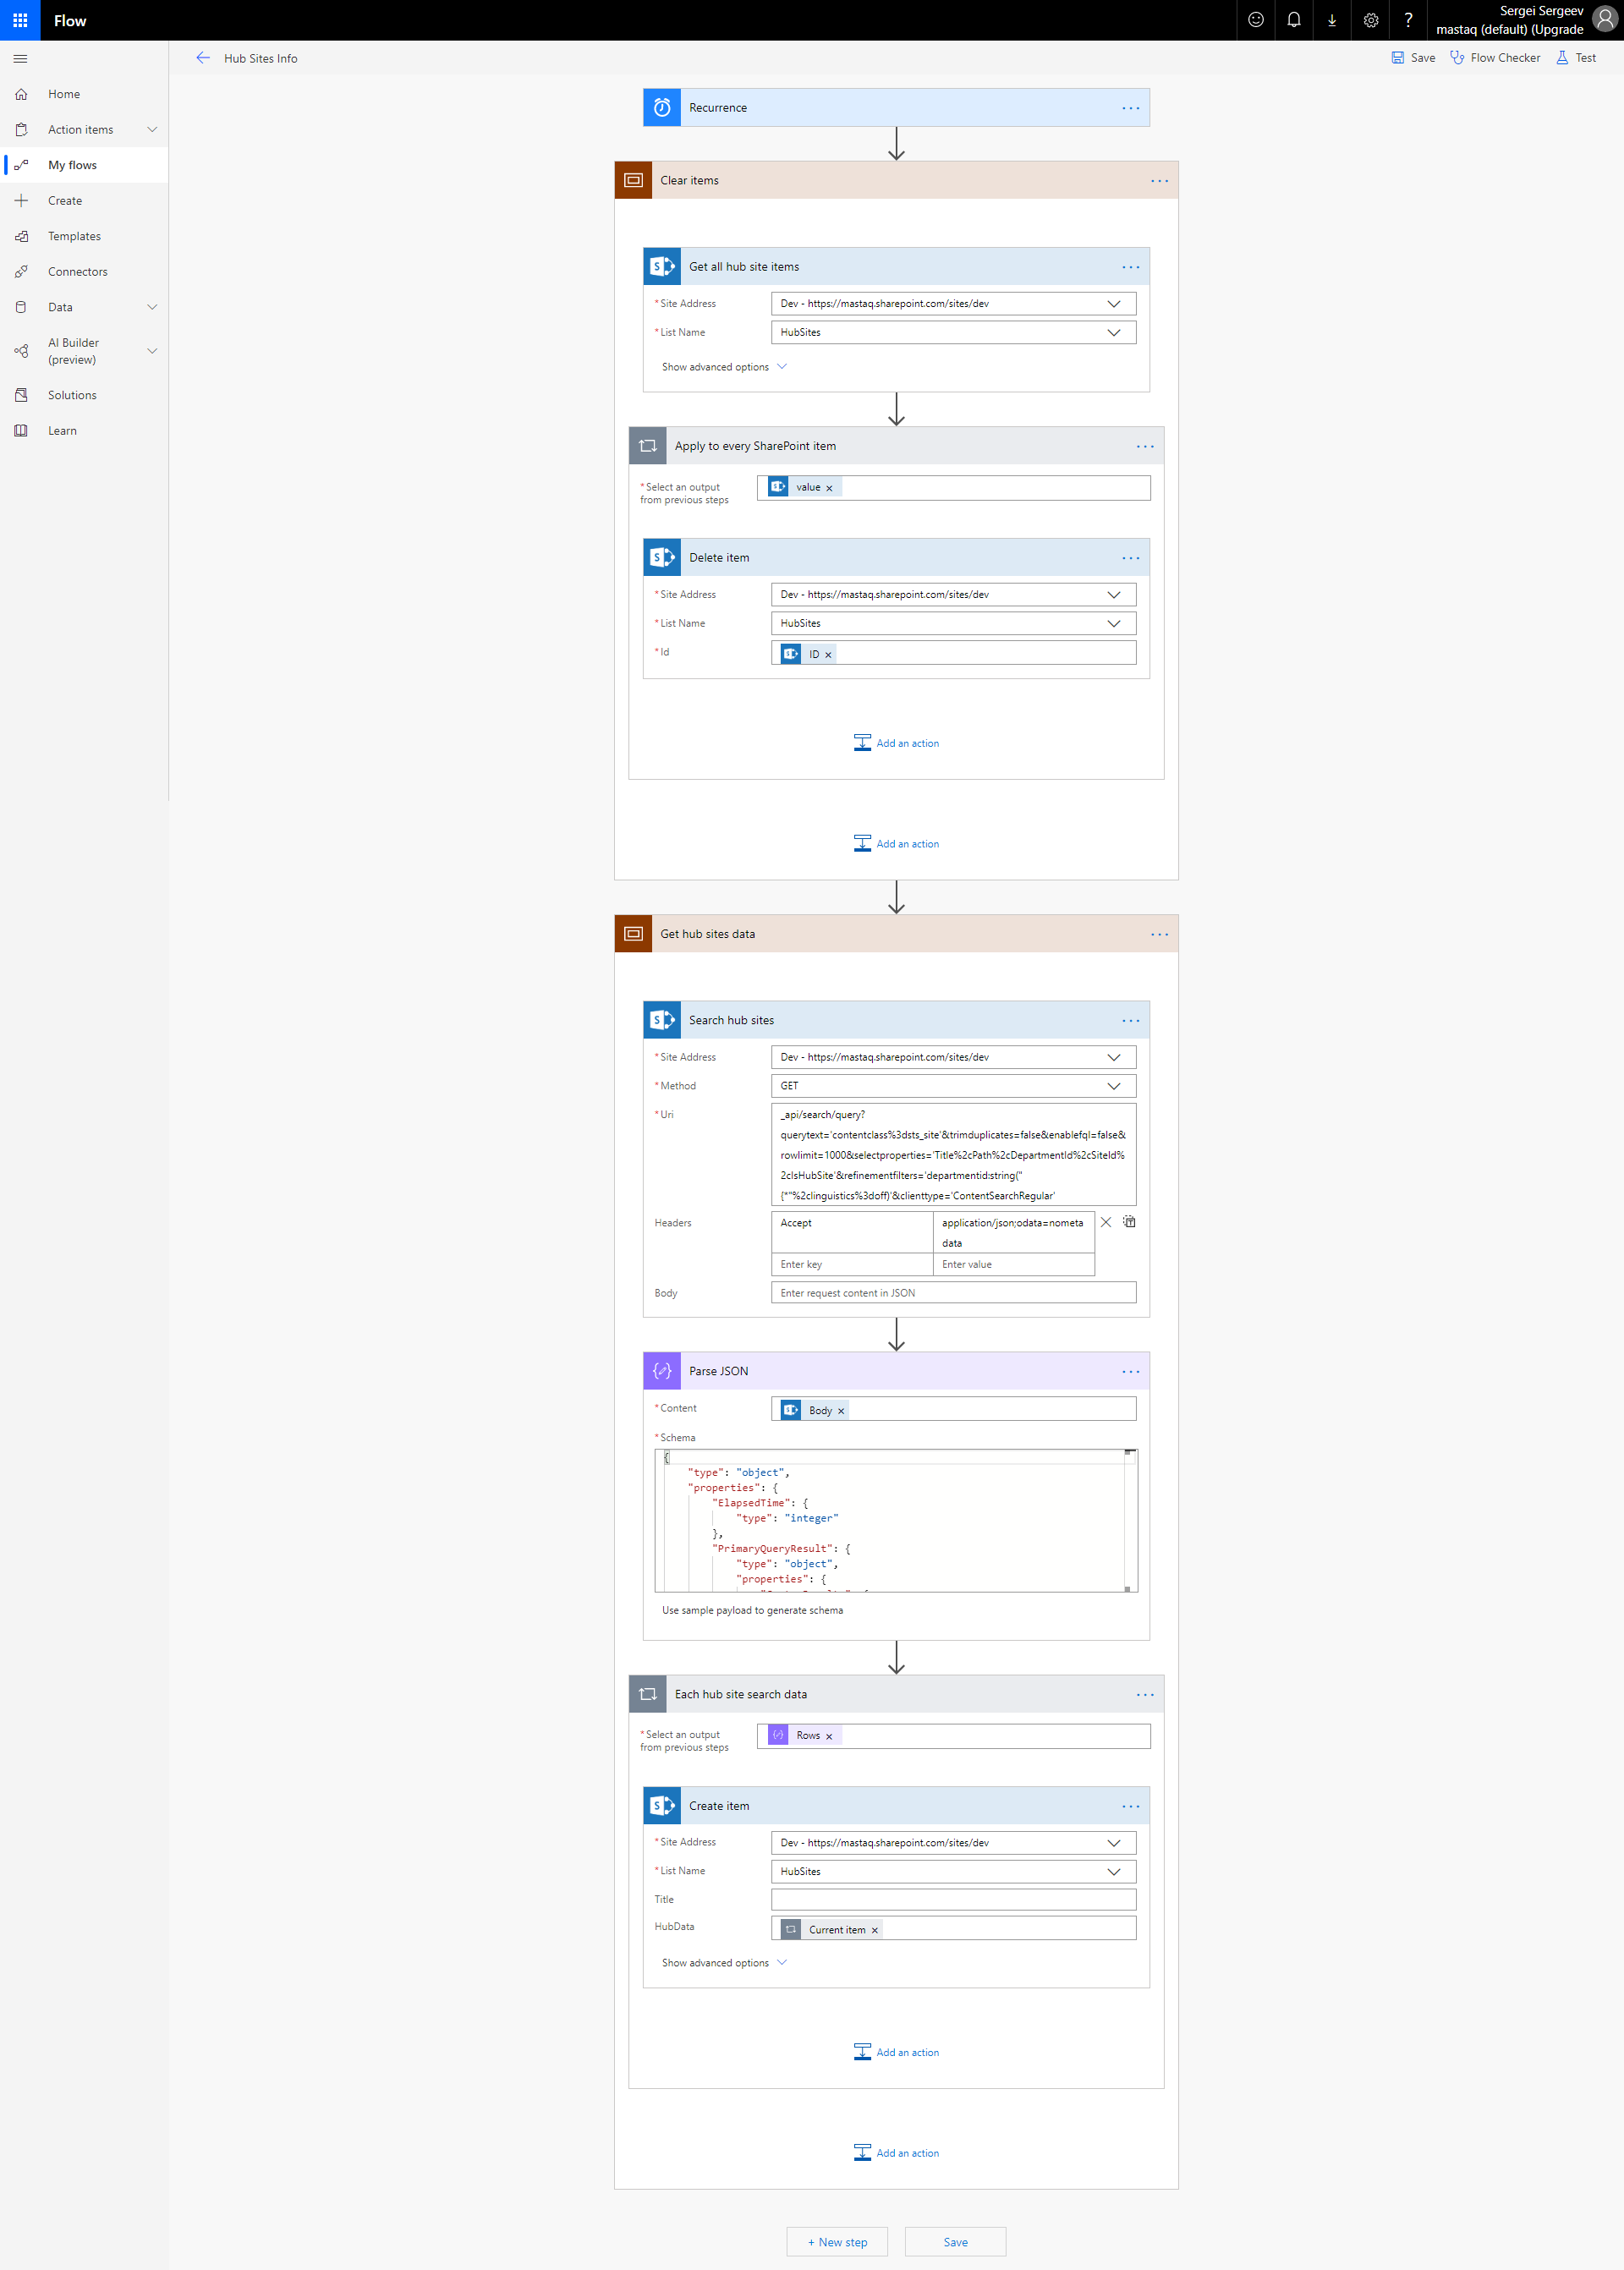
The process is fairly simple - clear all items in the list at the beginning. Then use search API to get all hub sites as well as associated sites. Parse search results and add new items in the list. As a result, we have a list with all sites and JSON data from the search API. Here is an approximate JSON you have:
{
	"Cells": [{
			"Key": "Rank",
			"Value": "16.9285297393799",
			"ValueType": "Edm.Double"
		}, {
			"Key": "DocId",
			"Value": "17605073274477",
			"ValueType": "Edm.Int64"
		}, {
			"Key": "Title",
			"Value": "Project X",
			"ValueType": "Edm.String"
		}, {
			"Key": "Path",
			"Value": "https://mastaq.sharepoint.com/sites/ProjectX",
			"ValueType": "Edm.String"
		}, {
			"Key": "DepartmentId",
			"Value": "{cfee8b51-104d-4811-b1d9-c8e6faa70a4d}",
			"ValueType": "Edm.String"
		}, {
			"Key": "SiteId",
			"Value": "aa010029-52b2-431a-b45e-ee80f9850cc6",
			"ValueType": "Edm.String"
		}, {
			"Key": "IsHubSite",
			"Value": null,
			"ValueType": "Null"
		}, {
			"Key": "OriginalPath",
			"Value": "https://mastaq.sharepoint.com/sites/ProjectX",
			"ValueType": "Edm.String"
		}
	]
}
Power BI
In Power BI you should add SharePoint list as a data source, then apply a few data transformations to make it available for further modeling with visuals. If you're interested in how to do that, see the HubSiteViewer - Excel.pbix (228.07 kb) and the data source - HubsData.xlsx (10.07 kb). It uses an Excel file as a data source, which is almost the same as SharePoint. You will get an idea of how I transformed the source data using power query. Basically, it's something like this:
let
    Source = Excel.Workbook(File.Contents("D:\OneDrive\Sources\HubSiteViewer\HubsData.xlsx"), null, true),
    Table1_Table = Source{[Item="Table1",Kind="Table"]}[Data],
    #"Changed Type3" = Table.TransformColumnTypes(Table1_Table,{{"Id", Int64.Type}, {"Hub", type text}}),
    #"Parsed JSON" = Table.TransformColumns(#"Changed Type3",{{"Hub", Json.Document}}),
    #"Expanded Hub" = Table.ExpandRecordColumn(#"Parsed JSON", "Hub", {"Cells"}, {"Cells"}),
    #"Expanded Cells" = Table.ExpandListColumn(#"Expanded Hub", "Cells"),
    #"Expanded Cells1" = Table.ExpandRecordColumn(#"Expanded Cells", "Cells", {"Key", "Value", "ValueType"}, {"Key", "Value", "ValueType"}),
    #"Removed Columns1" = Table.RemoveColumns(#"Expanded Cells1",{"ValueType"}),
    #"Pivoted Column" = Table.Pivot(#"Removed Columns1", List.Distinct(#"Removed Columns1"[Key]), "Key", "Value"),
    #"Removed Columns2" = Table.RemoveColumns(#"Pivoted Column",{"UrlZone", "Culture", "ResultTypeId", "RenderTemplateId"}),
    #"Appended Query" = Table.Combine({#"Removed Columns2", Root}),
    #"Changed Type" = Table.TransformColumnTypes(#"Appended Query",{{"DepartmentId", type text}}),
    #"Replaced Value" = Table.ReplaceValue(#"Changed Type","{","",Replacer.ReplaceText,{"DepartmentId"}),
    #"Replaced Value1" = Table.ReplaceValue(#"Replaced Value","}","",Replacer.ReplaceText,{"DepartmentId"}),
    #"Changed Type1" = Table.TransformColumnTypes(#"Replaced Value1",{{"IsHubSite", type logical}}),
    #"Added Custom" = Table.AddColumn(#"Changed Type1", "Parent", each if [IsHubSite] = true then "00000000-0000-0000-0000-000000000000" else [DepartmentId]),
    #"Added Custom1" = Table.AddColumn(#"Added Custom", "Type", each if [IsHubSite] = true then "Hub" else if [Parent] = null then "Root" else "Related"),
    #"Added Custom2" = Table.AddColumn(#"Added Custom1", "Relative Url", each Text.Replace([OriginalPath], "https://mastaq.sharepoint.com", ""))
in
    #"Added Custom2"
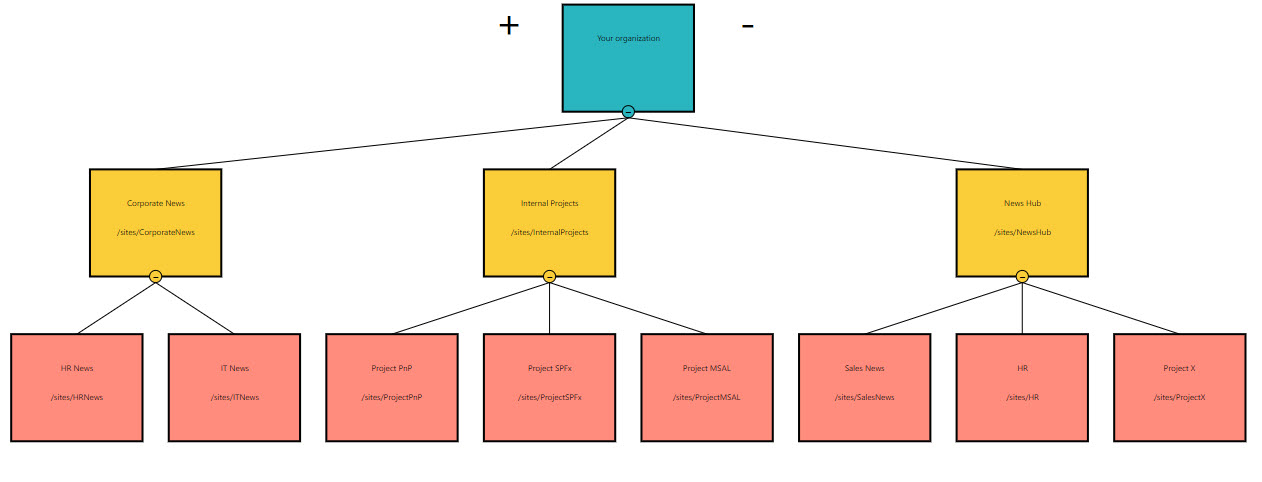
Data modeling
You can use different options here. I ended up with table view and third party tree view component:

Publish and configure SharePoint web part
This step is the easiest one. You should publish the report to Power BI, configure data refresh settings, then create a new modern page and add a Power BI web part. That's it! Now you have a nice visual representation of all of your hub sites.
What's next?
Office 365 provides a lot of ways to do cool things. Learn them, use them, combine them to achieve awesome results and efficiency in almost any sphere inside your organization.
That was just another example of what is possible just out of the box, with a little help of MS Flow and Power BI.